Unlock a world of possibilities! Login now and discover the exclusive benefits awaiting you.
- Qlik Community
- :
- All Forums
- :
- QlikView App Dev
- :
- Formula help
- Subscribe to RSS Feed
- Mark Topic as New
- Mark Topic as Read
- Float this Topic for Current User
- Bookmark
- Subscribe
- Mute
- Printer Friendly Page
- Mark as New
- Bookmark
- Subscribe
- Mute
- Subscribe to RSS Feed
- Permalink
- Report Inappropriate Content
Formula help
Hi All,
I have period , flag and market as fields in a list box and I am trying to calculate average for YTD .
The problem is when i select period and flag the average value is showing for that month. instead of showing for selected months and dividing by the selected month.
For ex: I have month selected as march. the values for jan and feb and mar are 10,20,30. I need to get output as (10+20+30)/3 = 20
But i here it is happening 30/3 =10.
This is happening only if i select period and if i remove period and select any other combination i am getting value correctly.
Below image for your reference:
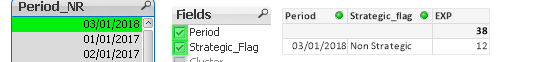
Here the value is showing is 12 instead of 38. Can you please help me where i am doing wrong.
Formula i have used is
=If(SubStringCount('|' & Concat(distinct Dimension2, '|') & '|', '|Flag|'),Num(SUM({<Period_NR={'>=$(=MonthStart(vCurrYear_SelectedMnth1, 1-NUM(Month(vCurrYear_SelectedMnth1))))<=$(=vCurrYear_SelectedMnth1)'}
>}IB),'#,##0.0%')/Month(Period_NR))
Please let me know if you need anything.
Thanks,
Bharat
Accepted Solutions
- Mark as New
- Bookmark
- Subscribe
- Mute
- Subscribe to RSS Feed
- Permalink
- Report Inappropriate Content
If you need to use the expression in a chart you will have to use the TOTAL qualifier in the Sum() like this:
- Mark as New
- Bookmark
- Subscribe
- Mute
- Subscribe to RSS Feed
- Permalink
- Report Inappropriate Content
If you are using a recent version of QlikView like QlikView November 2017 or newer you should use the correct quotation marks for a search which is double quotes - not single quotes as you have used. In older versions QlikView didn't care whether you had single or double quotation marks for search actually....
=If(SubStringCount('|' & Concat(distinct Dimension2, '|') & '|', '|Flag|'),Num(SUM({<Period_NR={">=$(=MonthStart(vCurrYear_SelectedMnth1, 1-NUM(Month(vCurrYear_SelectedMnth1))))<=$(=vCurrYear_SelectedMnth1)"}
>}IB),'#,##0.0%')/Month(Period_NR))
- Mark as New
- Bookmark
- Subscribe
- Mute
- Subscribe to RSS Feed
- Permalink
- Report Inappropriate Content
Hi Peter,
Thank you for your reply.
But still i am getting the same value as 12 instead of 38. It is not summing up. Do i need to use rangesum or anything or i need to do.
Please let me know
- Mark as New
- Bookmark
- Subscribe
- Mute
- Subscribe to RSS Feed
- Permalink
- Report Inappropriate Content
stalwar1 Can you please help me Sunny Bhai..
- Mark as New
- Bookmark
- Subscribe
- Mute
- Subscribe to RSS Feed
- Permalink
- Report Inappropriate Content
Hi,
Check your variables that they are working correctly when selecting the Period_NR by placing them in text boxes and making the selection.
Other than that I'm not seeing any issues, the only thing would be if there are other selections besides the periods that influence the data set and disqualifies the months before March.
- Mark as New
- Bookmark
- Subscribe
- Mute
- Subscribe to RSS Feed
- Permalink
- Report Inappropriate Content
I am attaching the file for reference. Please let me know if you need anything more.
When i take expression total 38 is coming correct. But in the chart it is showing 12 only for that month instead of 38.
Kindly check.
- Mark as New
- Bookmark
- Subscribe
- Mute
- Subscribe to RSS Feed
- Permalink
- Report Inappropriate Content
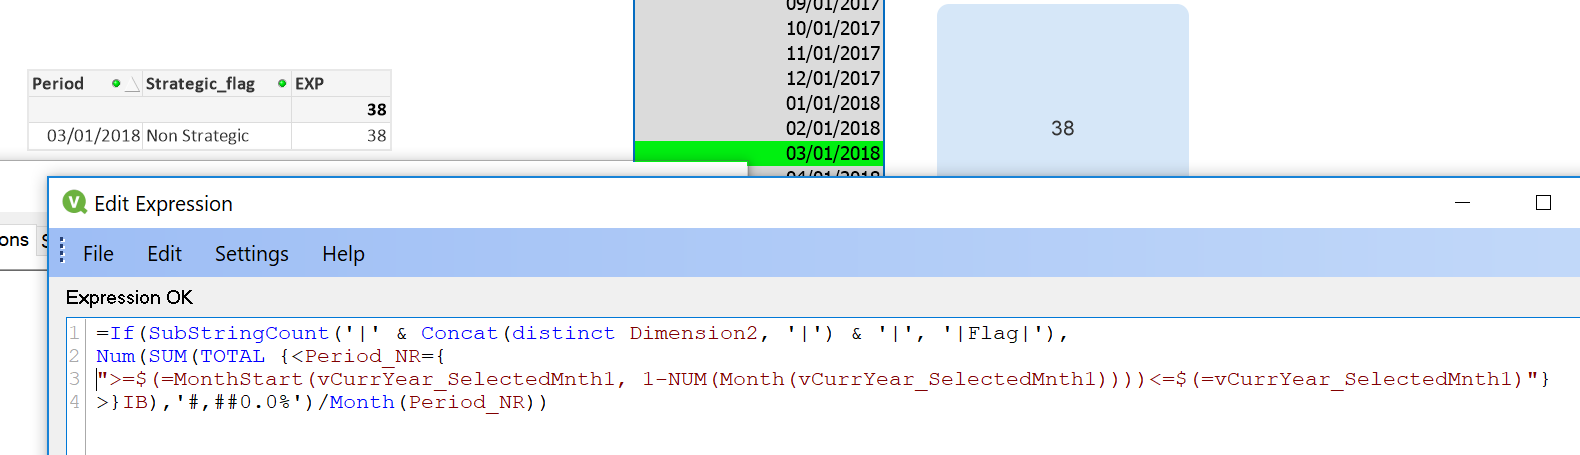
When I put in the expression I suggested to you in my first response I get the correct result which is 38:
![2018-08-10 12_36_29-QlikView x64 - Evaluation Copy - [C__Users_pts_Downloads_T.qvw_].png](/legacyfs/online/210520_2018-08-10 12_36_29-QlikView x64 - Evaluation Copy - [C__Users_pts_Downloads_T.qvw_].png)
So it seems like you got your answer then doesn't it?
- Mark as New
- Bookmark
- Subscribe
- Mute
- Subscribe to RSS Feed
- Permalink
- Report Inappropriate Content
If you need to use the expression in a chart you will have to use the TOTAL qualifier in the Sum() like this:
- Mark as New
- Bookmark
- Subscribe
- Mute
- Subscribe to RSS Feed
- Permalink
- Report Inappropriate Content
Yes. But in chart it is showing as 12. That is why i don't know where it is getting wrong.
- Mark as New
- Bookmark
- Subscribe
- Mute
- Subscribe to RSS Feed
- Permalink
- Report Inappropriate Content
Thank you Peter.. Missed it..