Unlock a world of possibilities! Login now and discover the exclusive benefits awaiting you.
- Qlik Community
- :
- All Forums
- :
- QlikView App Dev
- :
- Formula to find the trend in Pivot table
- Subscribe to RSS Feed
- Mark Topic as New
- Mark Topic as Read
- Float this Topic for Current User
- Bookmark
- Subscribe
- Mute
- Printer Friendly Page
- Mark as New
- Bookmark
- Subscribe
- Mute
- Subscribe to RSS Feed
- Permalink
- Report Inappropriate Content
Formula to find the trend in Pivot table
Hello,
on a weekly basis I receive a report with the amount of sold items per each shop.
We have several shops in different countries.
I have a Pivot Table, where I calculated the Sum(SALES) based on the dimensions COUNTRY and DATE.
I would like now to add an expression to calculate the trend (using linest_m ) of the last 3 weeks per each specific country.. would it be possible?
| COUNTRY | DATE | SALES | trend last 3 weeks |
| A | 42 | 20 | -10 |
| A | 41 | 30 | 9 |
| A | 40 | 40 | 13.5 |
| A | 39 | 12 | -1 |
| A | 38 | 13 | -4.5 |
| A | 37 | 14 | |
| A | 36 | 22 | |
| B | 42 | 23 | 3 |
| B | 41 | 24 | 3 |
| B | 40 | 17 | -1 |
| B | 39 | 18 | -26 |
| B | 38 | 19 | -30.5 |
| B | 37 | 70 | |
| B | 36 | 80 | |
| … |
- Mark as New
- Bookmark
- Subscribe
- Mute
- Subscribe to RSS Feed
- Permalink
- Report Inappropriate Content
Hello guys, any idea how to proceed?
- Mark as New
- Bookmark
- Subscribe
- Mute
- Subscribe to RSS Feed
- Permalink
- Report Inappropriate Content
Looks like you have Historical Data? Why you want to use Linest_M ?? Little confused, How you calculated the data?
- Mark as New
- Bookmark
- Subscribe
- Mute
- Subscribe to RSS Feed
- Permalink
- Report Inappropriate Content
what's the logic for last column? have you already calculated it or you need expression for that?
- Mark as New
- Bookmark
- Subscribe
- Mute
- Subscribe to RSS Feed
- Permalink
- Report Inappropriate Content
Marika,
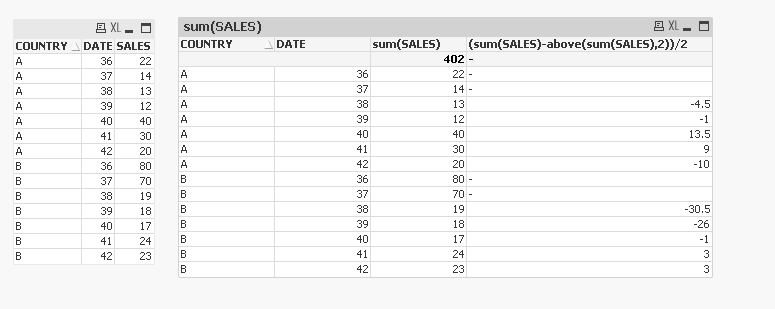
If you just want to replicate what you have you can try (sum(SALES)-above(sum(SALES),2))/2;

Regards,
Chris.
- Mark as New
- Bookmark
- Subscribe
- Mute
- Subscribe to RSS Feed
- Permalink
- Report Inappropriate Content
Hello,
yes I have historical data, and every week with data load of new report they are concatenated and stored with old data in a qvd file.
What I want to do is to identify the coefficient of linear regression line (then will be represented with a red/green light) to evaluate the trend of last 3 weeks.
So if we are in week 42, I want to evaluate the trend taking into account weeks 42, 41 and 40 - so for every week and every country, I want to consider that specific week + the previous 2 weeks.
I prepared the table using fake data and excel with the formula Linest(known Y, known X)
Hope this clarify ![]()
- Mark as New
- Bookmark
- Subscribe
- Mute
- Subscribe to RSS Feed
- Permalink
- Report Inappropriate Content
Hello Chris,
I think that even if the result is the same, it's not what I'm looking for..
the table was created to simplify my case, in reality I need to consider 10 weeks, so probably it wont work ![]()
I used on excel the formula Linest(known Y, known X).
Thank you
- Mark as New
- Bookmark
- Subscribe
- Mute
- Subscribe to RSS Feed
- Permalink
- Report Inappropriate Content
Hello,
I need a formula to identify the coefficient of linear regression line (then will be represented with a red/green light) to evaluate the trend of last 3 weeks.
So if we are in week 42, I want to evaluate the trend taking into account weeks 42, 41 and 40 - so for every week and every country, I want to consider that specific week + the previous 2 weeks.
I prepared the table using fake data and excel with the formula Linest(known Y, known X)
- Mark as New
- Bookmark
- Subscribe
- Mute
- Subscribe to RSS Feed
- Permalink
- Report Inappropriate Content
Marika,
Yes, I see what you mean.
I tried to use above to feed into LINEST_M - there are a number of other threads that allude to issues with this suggesting using AGGR/TOTAL to get around this. It beat me.
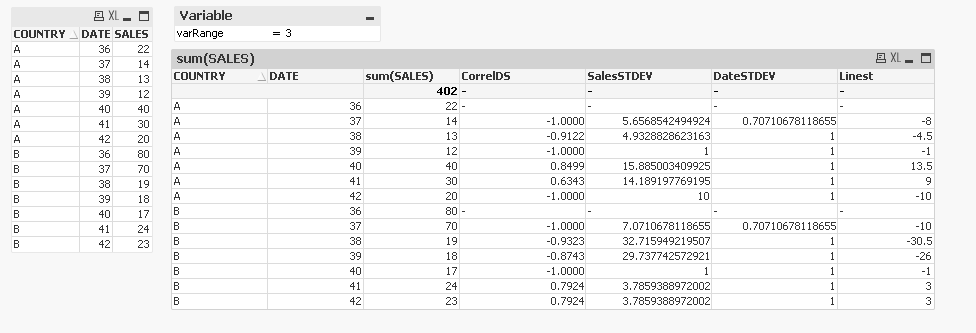
However I think there is a workaround using correlation coefficient and standard deviation to calculate the slope (Simple linear regression - Wikipedia) which do have range function equivalents, so this could be collapsed down, but right most columns below are given by;
=rangecorrel(above(only(DATE),0,$(varRange)),above(sum(SALES),0,$(varRange)))
=RangeStdev(above(sum(SALES),0,$(varRange)))
=RangeStdev(above(only(DATE),0,$(varRange)))
CorrelDS*SalesSTDEV/DateSTDEV

Also attaching the QVW (although have personal edition … so not sure if you will be able to open).
Hope this helps.
Cheers,
Chris.