Unlock a world of possibilities! Login now and discover the exclusive benefits awaiting you.
- Qlik Community
- :
- All Forums
- :
- QlikView App Dev
- :
- Re: Fractile Doubt Challenge
- Subscribe to RSS Feed
- Mark Topic as New
- Mark Topic as Read
- Float this Topic for Current User
- Bookmark
- Subscribe
- Mute
- Printer Friendly Page
- Mark as New
- Bookmark
- Subscribe
- Mute
- Subscribe to RSS Feed
- Permalink
- Report Inappropriate Content
Fractile Doubt Challenge
Hi guys, I have a doubt trying to classify my results.
I have a table of sales by customer, and I'd like to classify them with numbers, to see the quality of my customers, something like :
1 : 0-20% of the amount of sales
2 : 20-40% of the amount of sales
3 : 40-60% of the amount of sales
4 : 60-80% of the amount of sales
5 : 80-100% of the amount of sales
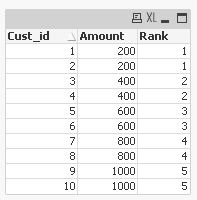
This would be my desired result :
| Cust_id | Amount | Rank |
| 1 | 200 | 1 |
| 2 | 200 | 1 |
| 3 | 400 | 2 |
| 4 | 400 | 2 |
| 5 | 600 | 3 |
| 6 | 600 | 3 |
| 7 | 800 | 4 |
| 8 | 800 | 4 |
| 9 | 1000 | 5 |
| 10 | 1000 | 5 |
Any ideas of how to do that? By rank function? fractile?
Many thanks in advance!
Regards, Marcel.
- Mark as New
- Bookmark
- Subscribe
- Mute
- Subscribe to RSS Feed
- Permalink
- Report Inappropriate Content
Marcel, I'm a little confused regarding your requirement. You mentioned that rank #1 would be "0-20% of the amount of sales." Does that mean that you want to order your sales-by-customer from smallest to largest, take the smallest X sales that add up to 20% of the total of all sales, and assign those customers to rank #1?
In your example, you're doing something different? It looks like the target you're comparing against is 1,000, which is the greatest sale for a single customer. So what your example does is, again, sorts sales-by-customer from smallest to largest, but then assigns a rank of #1 to those customers who have sales <=20% of the greatest sale (not the total).
Please clarify.
Vlad
- Mark as New
- Bookmark
- Subscribe
- Mute
- Subscribe to RSS Feed
- Permalink
- Report Inappropriate Content
Thanks Vlad, the point of this is to do a RFM Analysis, and I need the "scores" of some metrics. One of them is the amount.
I'd like to classify all the amounts by customer by score (5 is the maximum, and 1 is the lower). And I'm trying to do it with percentile, rank... with no success.
Do you know how to do it?
Best regards, Marcel.
- Mark as New
- Bookmark
- Subscribe
- Mute
- Subscribe to RSS Feed
- Permalink
- Report Inappropriate Content
Hi,
one solution could be:

SET vRankSize = '20%';

tabCustomers:
LOAD Cust_id,
    Amount
FROM [http://community.qlik.com/thread/141855] (html, codepage is 1252, embedded labels, table is @1);

Left Join
LOAD Max(Amount) as MaxAmount
Resident tabCustomers;

Left Join
LOAD Distinct
    Cust_id,
    Amount,
    Ceil(Amount/MaxAmount,'$(vRankSize)')/'$(vRankSize)' as Rank
Resident tabCustomers;

DROP Field MaxAmount
hope this helps
regards
Marco
- Mark as New
- Bookmark
- Subscribe
- Mute
- Subscribe to RSS Feed
- Permalink
- Report Inappropriate Content
Thanks Vlad, the point of this is to do a RFM Analysis, and I need the "scores" of some metrics. One of them is the amount.
I'd like to classify all the amounts by customer by score (5 is the maximum, and 1 is the lower). And I'm trying to do it with percentile, rank... with no success.
Do you know how to do it?
Best regards, Marcel.
- Mark as New
- Bookmark
- Subscribe
- Mute
- Subscribe to RSS Feed
- Permalink
- Report Inappropriate Content
Thanks Marco for the idea, nice try,
apologies for the misunderstanding, that table was just an example, and the calculation it has to be dynamic, in order to get 5 different groups. I think it is called a quintile, but in Qlikview it only exist the percentile function.
The idea is that each 20% belongs to a group (1,2,3,4,5) and it has to be selected as an expression.
Best Regards Marcel.
- Mark as New
- Bookmark
- Subscribe
- Mute
- Subscribe to RSS Feed
- Permalink
- Report Inappropriate Content
Marcel, I'm still confused. I don't understand if you're trying to rank 20% of your customers or 20% of your volume. I'm going to assume you mean customers. Try this:
5*ceil(rank(-sum(Amount),4,1)/count(distinct total Cust_id),.2)
Edited to add "total" to denominator.
Regards,
Vlad
- Mark as New
- Bookmark
- Subscribe
- Mute
- Subscribe to RSS Feed
- Permalink
- Report Inappropriate Content
Sorry Vlad if I'm not explaining very well, what I'm trying to do is to classify my customers in 5 groups (as the percentile does). The group 1 is the group of the lowest purchases and the group 5 is the group of the higher purchases. If you see the RFM analysis on the web, you're going to understand it very well. The goal of this is to put an score to a customer.
Regards, Marcel.
- Mark as New
- Bookmark
- Subscribe
- Mute
- Subscribe to RSS Feed
- Permalink
- Report Inappropriate Content
Let me try to ask it another way: will each of your five groups have the same number of customers?
Vlad
- Mark as New
- Bookmark
- Subscribe
- Mute
- Subscribe to RSS Feed
- Permalink
- Report Inappropriate Content
Hey,
Here is my theread and attached document for Fractile.