Unlock a world of possibilities! Login now and discover the exclusive benefits awaiting you.
- Qlik Community
- :
- All Forums
- :
- QlikView App Dev
- :
- Full Accumulation on over the dimension
- Subscribe to RSS Feed
- Mark Topic as New
- Mark Topic as Read
- Float this Topic for Current User
- Bookmark
- Subscribe
- Mute
- Printer Friendly Page
- Mark as New
- Bookmark
- Subscribe
- Mute
- Subscribe to RSS Feed
- Permalink
- Report Inappropriate Content
Full Accumulation on over the dimension
Dear All,
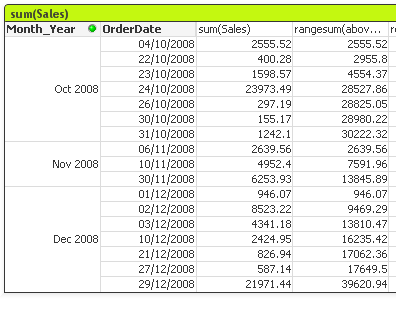
Need help one the over come the problem. Like Output Need Like Last column.
Please help me..
| OrderDate | sum(Sales) | rangesum(above(sum(Sales),0,rowno())) | Output Need Help |
| 83689.15 | 0 | ||
| 04/10/2008 | 2555.52 | 2555.52 | 2555.52 |
| 22/10/2008 | 400.28 | 2955.8 | 2955.8 |
| 23/10/2008 | 1598.57 | 4554.37 | 4554.37 |
| 24/10/2008 | 23973.49 | 28527.86 | 28527.86 |
| 26/10/2008 | 297.19 | 28825.05 | 28825.05 |
| 30/10/2008 | 155.17 | 28980.22 | 28980.22 |
| 31/10/2008 | 1242.1 | 30222.32 | 30222.32 |
| 06/11/2008 | 2639.56 | 32861.88 | 2639.56 |
| 10/11/2008 | 4952.4 | 37814.28 | 7592 |
| 30/11/2008 | 6253.93 | 44068.21 | 13846 |
| 01/12/2008 | 946.07 | 45014.28 | 946.07 |
| 02/12/2008 | 8523.22 | 53537.5 | 9469 |
| 03/12/2008 | 4341.18 | 57878.68 | 13810 |
| 10/12/2008 | 2424.95 | 60303.63 | 16235 |
| 21/12/2008 | 826.94 | 61130.57 | 17062 |
| 27/12/2008 | 587.14 | 61717.71 | 17650 |
| 29/12/2008 | 21971.44 | 83689.15 | 39621 |
Accepted Solutions
- Mark as New
- Bookmark
- Subscribe
- Mute
- Subscribe to RSS Feed
- Permalink
- Report Inappropriate Content
I think what you are describing should be the default behaviour of QV, considering the column segments in a chart to reset the accumulation. See attached.
- Mark as New
- Bookmark
- Subscribe
- Mute
- Subscribe to RSS Feed
- Permalink
- Report Inappropriate Content
I think what you are describing should be the default behaviour of QV, considering the column segments in a chart to reset the accumulation. See attached.
- Mark as New
- Bookmark
- Subscribe
- Mute
- Subscribe to RSS Feed
- Permalink
- Report Inappropriate Content
If pivot table is an option, adding Month_Year field as the first dimension could the solution.

- Mark as New
- Bookmark
- Subscribe
- Mute
- Subscribe to RSS Feed
- Permalink
- Report Inappropriate Content
without Month Year field , it will calculate the same .......?
- Mark as New
- Bookmark
- Subscribe
- Mute
- Subscribe to RSS Feed
- Permalink
- Report Inappropriate Content
Thanks for reply, without month year filed it will calculate .... ?
- Mark as New
- Bookmark
- Subscribe
- Mute
- Subscribe to RSS Feed
- Permalink
- Report Inappropriate Content
Not by default, but you can check in your expression for a change in month.
See attached sample.
- Mark as New
- Bookmark
- Subscribe
- Mute
- Subscribe to RSS Feed
- Permalink
- Report Inappropriate Content
Thanks for reply,
If I add the one more expression on the same table like QTD also it work ?
- Mark as New
- Bookmark
- Subscribe
- Mute
- Subscribe to RSS Feed
- Permalink
- Report Inappropriate Content
It should work also with other expressions. How does your QTD expression look like?
- Mark as New
- Bookmark
- Subscribe
- Mute
- Subscribe to RSS Feed
- Permalink
- Report Inappropriate Content
Thanks a lot
- Mark as New
- Bookmark
- Subscribe
- Mute
- Subscribe to RSS Feed
- Permalink
- Report Inappropriate Content
thanks a lot