Unlock a world of possibilities! Login now and discover the exclusive benefits awaiting you.
Announcements
NEW: Seamless Public Data Sharing with Qlik's New Anonymous Access Capability:
TELL ME MORE!
- Qlik Community
- :
- All Forums
- :
- QlikView App Dev
- :
- Gauge Chart - chart cant show segment for LOW MEDI...
Options
- Subscribe to RSS Feed
- Mark Topic as New
- Mark Topic as Read
- Float this Topic for Current User
- Bookmark
- Subscribe
- Mute
- Printer Friendly Page
Turn on suggestions
Auto-suggest helps you quickly narrow down your search results by suggesting possible matches as you type.
Showing results for
Specialist
2016-10-28
08:47 PM
- Mark as New
- Bookmark
- Subscribe
- Mute
- Subscribe to RSS Feed
- Permalink
- Report Inappropriate Content
Gauge Chart - chart cant show segment for LOW MEDIUM HIGH.
HI guys,
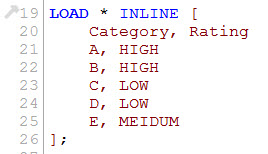
I wanted to create a capsule gauge chart with the sample inline data.
- I need 3 segements - Low Medium and HIGH.
- by right - it should show 2 high, 2 low , 1 medium
i only use - expression count(category)

Rgds.
Jim
- Tags:
- gauge chart
1,033 Views
1 Solution
Accepted Solutions
Master II
2016-10-29
07:01 AM
- Mark as New
- Bookmark
- Subscribe
- Mute
- Subscribe to RSS Feed
- Permalink
- Report Inappropriate Content
903 Views
7 Replies
Specialist
2016-10-28
08:48 PM
Author
- Mark as New
- Bookmark
- Subscribe
- Mute
- Subscribe to RSS Feed
- Permalink
- Report Inappropriate Content
Possible to display the value on data points as well?
903 Views
Master II
2016-10-29
05:46 AM
- Mark as New
- Bookmark
- Subscribe
- Mute
- Subscribe to RSS Feed
- Permalink
- Report Inappropriate Content
It seems that your qvw file is empty!
Please reupload the qvw with data!
903 Views
Specialist
2016-10-29
05:50 AM
Author
- Mark as New
- Bookmark
- Subscribe
- Mute
- Subscribe to RSS Feed
- Permalink
- Report Inappropriate Content
is inline data bro.

903 Views
Specialist
2016-10-29
05:51 AM
Author
- Mark as New
- Bookmark
- Subscribe
- Mute
- Subscribe to RSS Feed
- Permalink
- Report Inappropriate Content
as per attached.
903 Views
Master II
2016-10-29
06:30 AM
- Mark as New
- Bookmark
- Subscribe
- Mute
- Subscribe to RSS Feed
- Permalink
- Report Inappropriate Content
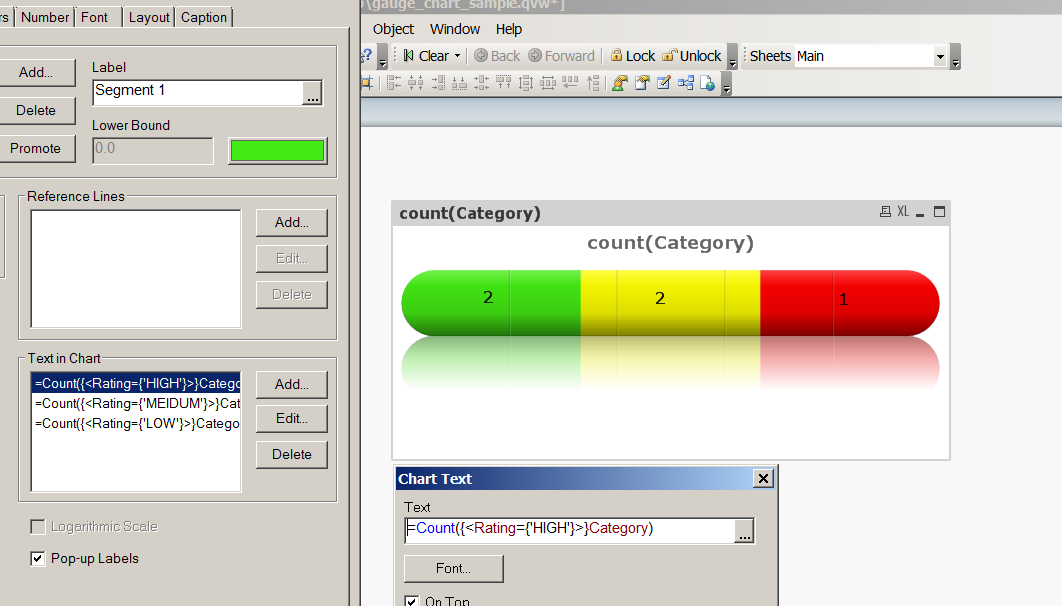
Like this?

903 Views
Specialist
2016-10-29
06:35 AM
Author
- Mark as New
- Bookmark
- Subscribe
- Mute
- Subscribe to RSS Feed
- Permalink
- Report Inappropriate Content
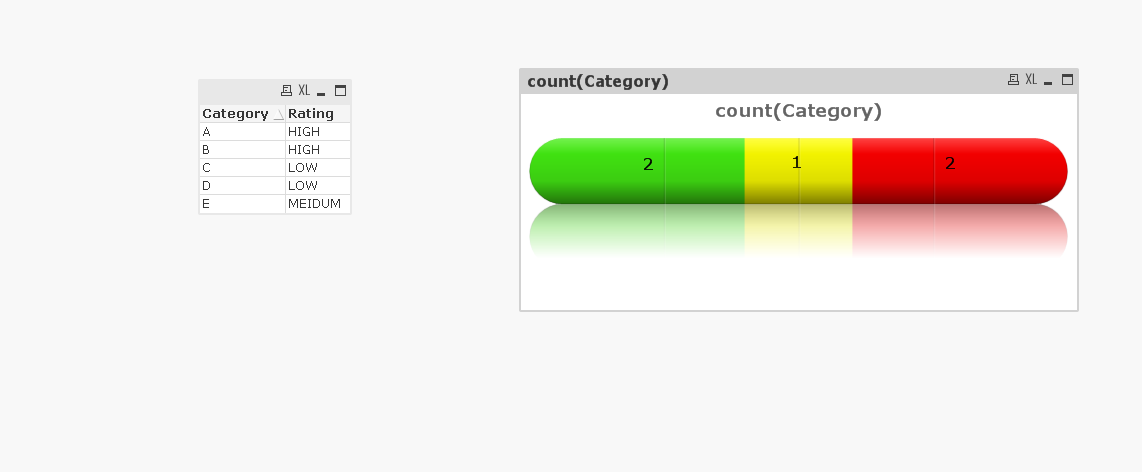
although there are 3 segments already, how to create it in such a way then the RED(HIGH) segment should look shorter than the other 2 as RED only has 1.
right now, all segment cuttings look the same.
903 Views
Master II
2016-10-29
07:01 AM
- Mark as New
- Bookmark
- Subscribe
- Mute
- Subscribe to RSS Feed
- Permalink
- Report Inappropriate Content
like this?

904 Views