Unlock a world of possibilities! Login now and discover the exclusive benefits awaiting you.
- Qlik Community
- :
- All Forums
- :
- QlikView App Dev
- :
- Re: Gauge of varios values together
- Subscribe to RSS Feed
- Mark Topic as New
- Mark Topic as Read
- Float this Topic for Current User
- Bookmark
- Subscribe
- Mute
- Printer Friendly Page
- Mark as New
- Bookmark
- Subscribe
- Mute
- Subscribe to RSS Feed
- Permalink
- Report Inappropriate Content
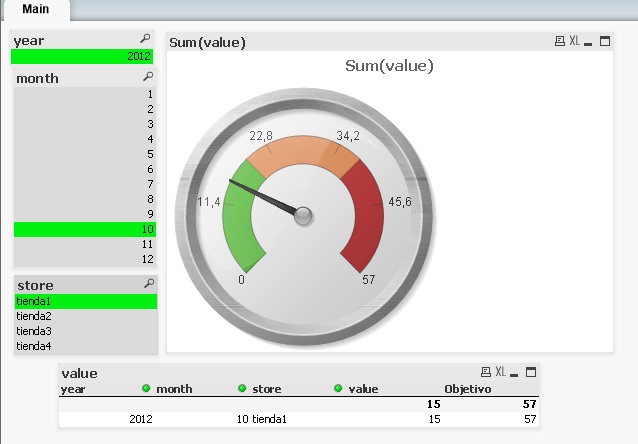
Gauge of varios values together
I have done the goal and a set of stores
Would want to have a gauge for each.
If I do it with graphics separate out the store only selected in the filter and not all
and if I make a graph representation of gauge table, putting the maximum as an expression fails
any ideas?
Accepted Solutions
- Mark as New
- Bookmark
- Subscribe
- Mute
- Subscribe to RSS Feed
- Permalink
- Report Inappropriate Content
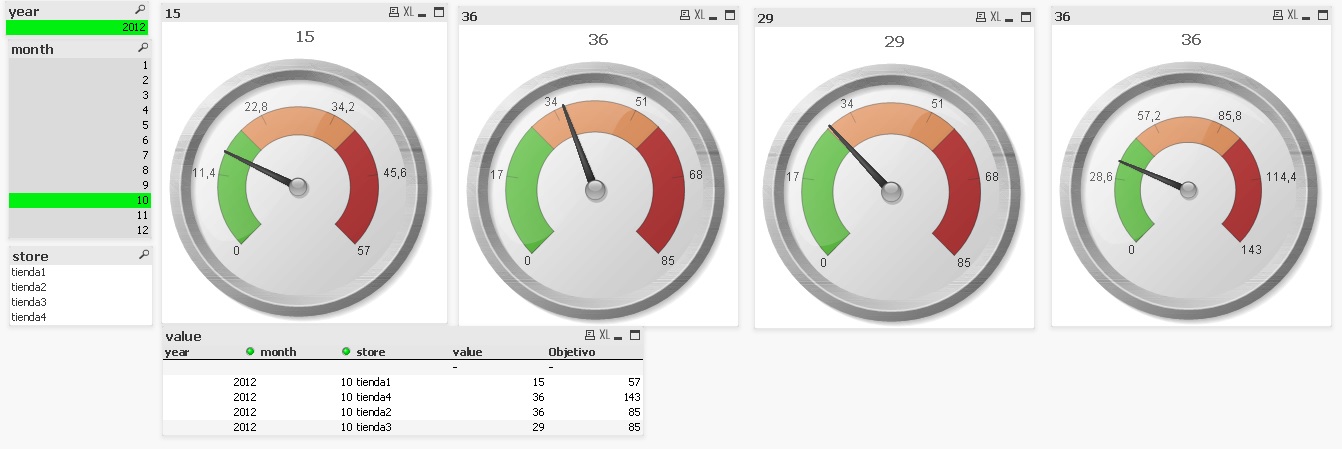
It sounds to me like you want 4 gauges that do not change if you select a store.
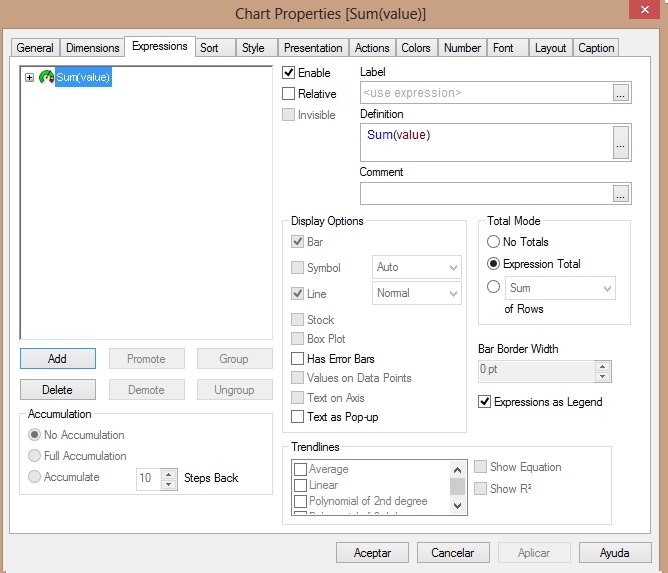
That would be done by changing the expressions to the following:
sum({< store = {'tenda1'}
>} value)
sum({< store = {'tenda2'}
>} value)
sum({< store = {'tenda3'}
>} value)
sum({< store = {'tenda4'}
>} value)
- Mark as New
- Bookmark
- Subscribe
- Mute
- Subscribe to RSS Feed
- Permalink
- Report Inappropriate Content
I dont understand your problem. Can you explain and perhaps provide a screenshot?
- Mark as New
- Bookmark
- Subscribe
- Mute
- Subscribe to RSS Feed
- Permalink
- Report Inappropriate Content
I think you want to do this:
http://community.qlik.com/message/357538#357538
Check the last Gysbter response.
- Mark as New
- Bookmark
- Subscribe
- Mute
- Subscribe to RSS Feed
- Permalink
- Report Inappropriate Content
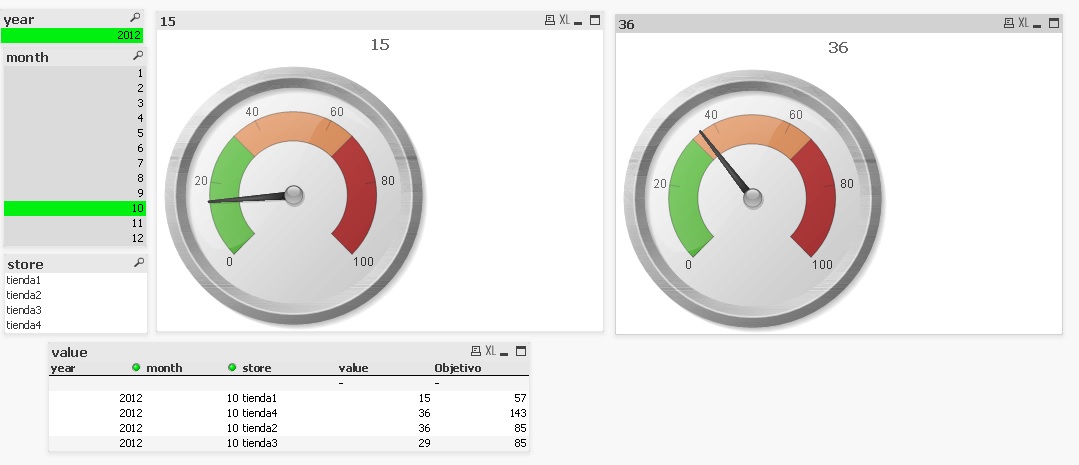
If you select a store, get the gauge to your goal, but for a store.
and if I select the store in the filter get the data, but
I would want to have 4 at a time with the 4 shops and remove the filter from the shops
thanks
- Mark as New
- Bookmark
- Subscribe
- Mute
- Subscribe to RSS Feed
- Permalink
- Report Inappropriate Content
It sounds to me like you want 4 gauges that do not change if you select a store.
That would be done by changing the expressions to the following:
sum({< store = {'tenda1'}
>} value)
sum({< store = {'tenda2'}
>} value)
sum({< store = {'tenda3'}
>} value)
sum({< store = {'tenda4'}
>} value)
- Mark as New
- Bookmark
- Subscribe
- Mute
- Subscribe to RSS Feed
- Permalink
- Report Inappropriate Content
correct! thanks
and to put the maximum value of that store for each gauge?
is the field Objetivo
- Mark as New
- Bookmark
- Subscribe
- Mute
- Subscribe to RSS Feed
- Permalink
- Report Inappropriate Content
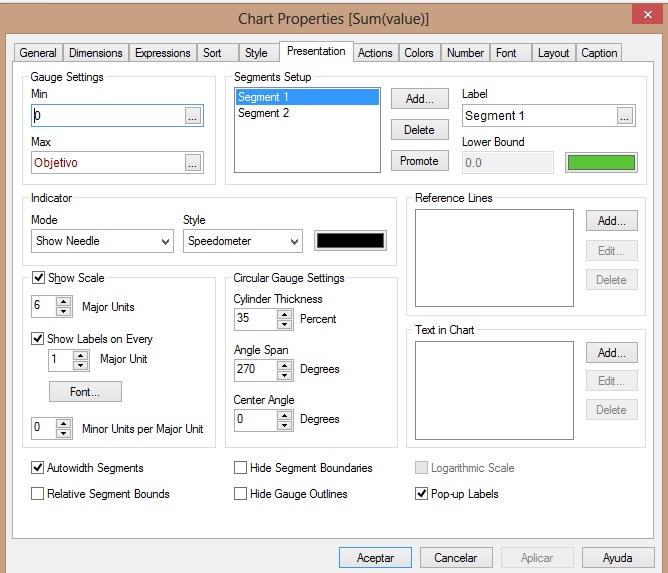
In the presentation tab try changing the max value to:
Sum({< store = {'tenda1'}
>} Objetivo )
- Mark as New
- Bookmark
- Subscribe
- Mute
- Subscribe to RSS Feed
- Permalink
- Report Inappropriate Content
Perfect!!!
thanks!