Unlock a world of possibilities! Login now and discover the exclusive benefits awaiting you.
- Qlik Community
- :
- All Forums
- :
- QlikView App Dev
- :
- Re: Generating Date Columns
- Subscribe to RSS Feed
- Mark Topic as New
- Mark Topic as Read
- Float this Topic for Current User
- Bookmark
- Subscribe
- Mute
- Printer Friendly Page
- Mark as New
- Bookmark
- Subscribe
- Mute
- Subscribe to RSS Feed
- Permalink
- Report Inappropriate Content
Generating Date Columns
Hi Team,
I am new to QlikView Date function. I need to get the following output table for different Date columns as listed in the table where, I have the calendar table in place.
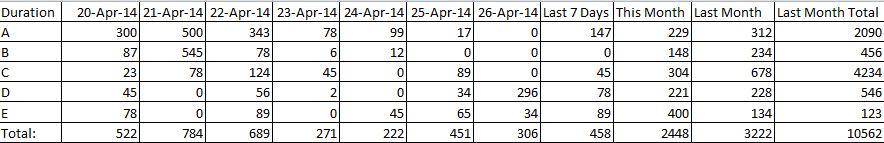
It would be very helpful, if anyone could suggest me, how to generate/calculate this kind of a table with different Dates columns populating data.
My understanding :
1) Use a Pivot table
2) To use a Calculated dimension OR
3) Create 11 different variables(i.e. -1 every variable) and use it in set analysis to achieve the same.
Can anyone update me how to carry out the same (i.e. How to create such Date related variables and apply the same in Set analysis)
Appreciate your inputs.
Thanks,
Robin
- « Previous Replies
-
- 1
- 2
- Next Replies »
- Mark as New
- Bookmark
- Subscribe
- Mute
- Subscribe to RSS Feed
- Permalink
- Report Inappropriate Content
It would be ideal if you can provide the sample data. Then we can guide you on how you can create the above using the pivot table.
Best,
Sunny
- Mark as New
- Bookmark
- Subscribe
- Mute
- Subscribe to RSS Feed
- Permalink
- Report Inappropriate Content
My advice is to use a straight table with 11 different expressions using set analysis.
A pivot table won't work unless you create a table that links the dates with a field with values like 'Last 7 Days', 'This Month', etc. and with the date values themselves.
talk is cheap, supply exceeds demand
- Mark as New
- Bookmark
- Subscribe
- Mute
- Subscribe to RSS Feed
- Permalink
- Report Inappropriate Content
Hi Gysbert and Sunidia,
Thanks for your inputs.
@Gysbert : I agree with you, we cannot create a Pivot table until and unless we have a link or hierarchy between. Thus, straight table would work fine in this case.
So can you assist me how can we create the 11 variables w.r.t to get the Dates (i.e. -1 each time) or simply frame 11 set expressions to achieve the same. It would be a great help to my app.
PS. I have two fact table in my model. I will be using order table (i.e. for Set analysis - Fact_Type=order)
Many Thanks,
Robin
- Mark as New
- Bookmark
- Subscribe
- Mute
- Subscribe to RSS Feed
- Permalink
- Report Inappropriate Content
You can find the basics here: YTQ, QTD, MTD and WTD. If you need specific help you'll have to give specific information. That means posting a qlikview document with example data so we can come up with a solution that you can apply directly in your real-world qlikview document.
talk is cheap, supply exceeds demand
- Mark as New
- Bookmark
- Subscribe
- Mute
- Subscribe to RSS Feed
- Permalink
- Report Inappropriate Content
Hi Robin,
Write separate expression for each column,
Example:
Last 7 days
=Sum({<Year=, Month=, Date={'>=$(=Date(Today() - 6))<=$(=Today())'}>} Sales)
This Month
=Sum({<Year=, Month=, Date={'>=$(=MonthStart(Today() ))<=$(=MonthEnd(Today()))'}>} Sales)
Last Month
=Sum({<Year=, Month=, Date={'>=$(=MonthStart(Today(), -1 ))<=$(=MonthEnd(Today(), -1))'}>} Sales)
Hope this helps you.
Regards,
Jagan.
- Mark as New
- Bookmark
- Subscribe
- Mute
- Subscribe to RSS Feed
- Permalink
- Report Inappropriate Content
Hi Team,
Apologies for the delay in response.
Thanks for your inputs and relevant documents. It added to my knowledge base of working with Date Functions
Jagan - I have implemented your solutions and it seems to work for me.
Can you guide me to generate the Date columns (i.e. 20-Apr-2014 --- 26-Apr-2014) Like do I need to create different variables to get them or how to set them, because every time I need to get last 7 days in column format.
@ Sunindia - As of, I do not have access to the database, as the model structure is designed by some other QV developer
Thanks Once Again for all the help and guidance.
Robin
- Mark as New
- Bookmark
- Subscribe
- Mute
- Subscribe to RSS Feed
- Permalink
- Report Inappropriate Content
HI,
For this type of Layout you have to use totally 11 expressions 7 for each day, 7days, this month, last month, last month total. Using the above expressions you can try.
Example:
=Sum({<Year=, Month=, Date={'20-Apr-2014'}>} Sales)
=Sum({<Year=, Month=, Date={'21-Apr-2014'}>} Sales)
=Sum({<Year=, Month=, Date={'22-Apr-2014'}>} Sales)
=Sum({<Year=, Month=, Date={'23-Apr-2014'}>} Sales)
=Sum({<Year=, Month=, Date={'24-Apr-2014'}>} Sales)
=Sum({<Year=, Month=, Date={'25-Apr-2014'}>} Sales)
=Sum({<Year=, Month=, Date={'26-Apr-2014'}>} Sales)
Last 7 days
=Sum({<Year=, Month=, Date={">=$('20-Apr-2014')<=$(='20-Apr-2014')"}>} Sales)
This Month
=Sum({<Year=, Month=, Date={">=$(=MonthStart('20-Apr-2014'))<=$(=MonthEnd('20-Apr-2014'))"}>} Sales)
Last Month
=Sum({<Year=, Month=, Date={">=$(=MonthStart('20-Apr-2014', -1 ))<=$(='26-Apr-2014')"}>} Sales)
Last Month Total
Last Month
=Sum({<Year=, Month=, Date={">=$(=MonthStart('20-Apr-2014', -1 ))<=$(=MonthEnd('26-Apr-2014', -1))"}>} Sales)
If possible attach the sample file.
Regards,
Jagan.
- Mark as New
- Bookmark
- Subscribe
- Mute
- Subscribe to RSS Feed
- Permalink
- Report Inappropriate Content
Hi Jagan,
Appreciate your quick guidance. I will try to paste the sample data.
Meanwhile, I had the following concerns :
1) For 7 Date expressions (20-Apr-2014,etc.), we have hard-coded the values in Set analysis, which on next reload may not reflect. Is there any way we can dynamically call the Dates or Set variables for every possible reload ?
2) How to get the Last Month Total ?
Thanks for all the valuable inputs.
Regards
Robin
- Mark as New
- Bookmark
- Subscribe
- Mute
- Subscribe to RSS Feed
- Permalink
- Report Inappropriate Content
HI,
You can try by using the Max(DateFieldname) so that you will get date dynamically in expressions based on your data
Example:
=Sum({<Year=, Month=, Date={'$(=Date(Max(Date) - 6))'}>} Sales)
=Sum({<Year=, Month=, Date={'$(=Date(Max(Date) - 5))'}>} Sales)
=Sum({<Year=, Month=, Date={'$(=Date(Max(Date) - 4))'}>} Sales)
=Sum({<Year=, Month=, Date={'$(=Date(Max(Date) - 3))'}>} Sales)
=Sum({<Year=, Month=, Date={'$(=Date(Max(Date) - 2))'}>} Sales)
=Sum({<Year=, Month=, Date={'$(=Date(Max(Date) - 1))'}>} Sales)
=Sum({<Year=, Month=, Date={'$(=Date(Max(Date) ))'}>} Sales)
Last 7 days
=Sum({<Year=, Month=, Date={">=$(=Date(Max(Date) -6)<=$(=Date(Max(Date) )"}>} Sales)
This Month
=Sum({<Year=, Month=, Date={">=$(=MonthStart(Max(Date)))<=$(=MonthEnd(Max(Date)))"}>} Sales)
Last Month
=Sum({<Year=, Month=, Date={">=$(=MonthStart(Max(Date), -1 ))<=$(=Date(Max(Date)))"}>} Sales)
Last Month Total
Last Month
=Sum({<Year=, Month=, Date={">=$(=MonthStart(Max(Date), -1 ))<=$(=MonthEnd(Max(Date), -1))"}>} Sales)
Hope this helps you.
Regards,
Jagan.
- « Previous Replies
-
- 1
- 2
- Next Replies »