Unlock a world of possibilities! Login now and discover the exclusive benefits awaiting you.
- Qlik Community
- :
- All Forums
- :
- QlikView App Dev
- :
- Re: Google Maps (US Map) in qlikview
- Subscribe to RSS Feed
- Mark Topic as New
- Mark Topic as Read
- Float this Topic for Current User
- Bookmark
- Subscribe
- Mute
- Printer Friendly Page
- Mark as New
- Bookmark
- Subscribe
- Mute
- Subscribe to RSS Feed
- Permalink
- Report Inappropriate Content
Google Maps (US Map) in qlikview
I was able to put google maps into my application but have couple of quick questions after it.
1) Map that I put is of fixed size(Showing Canada, US , Mexico, Parts of Europe), Played around it many times to just bring it down to US map but wasn't able to do it. How can I just keep it to US map?
2) Over the map image i put scatter chart showing circles over diffrent regions of US (North,South, West and so on)
Client came back asking if Circles can be divided like a pie chart and show percentage over it.
Scatter chart circle over google map (US) on North east region should split like a pie chart with states in North East US
(NY,NJ,PA,CT and so on )
3) If not a pie chart can we just put text over circle showing percentage value say West = 19% and North East = 24%
- Mark as New
- Bookmark
- Subscribe
- Mute
- Subscribe to RSS Feed
- Permalink
- Report Inappropriate Content
In answer to your point 1 assign the variable max_zoom_level between 1 to 17 in the middle. Note that 17 is the maximum zoom level. In this way you will have the zoom level changed to a better value so that you can display the map at US level. For point 3 this will be a expression change, mostly this would be the last expression in your chart.
- Mark as New
- Bookmark
- Subscribe
- Mute
- Subscribe to RSS Feed
- Permalink
- Report Inappropriate Content
Hi All,
GIS/Maps Analytics in QlikView is a very interesting topic indeed.
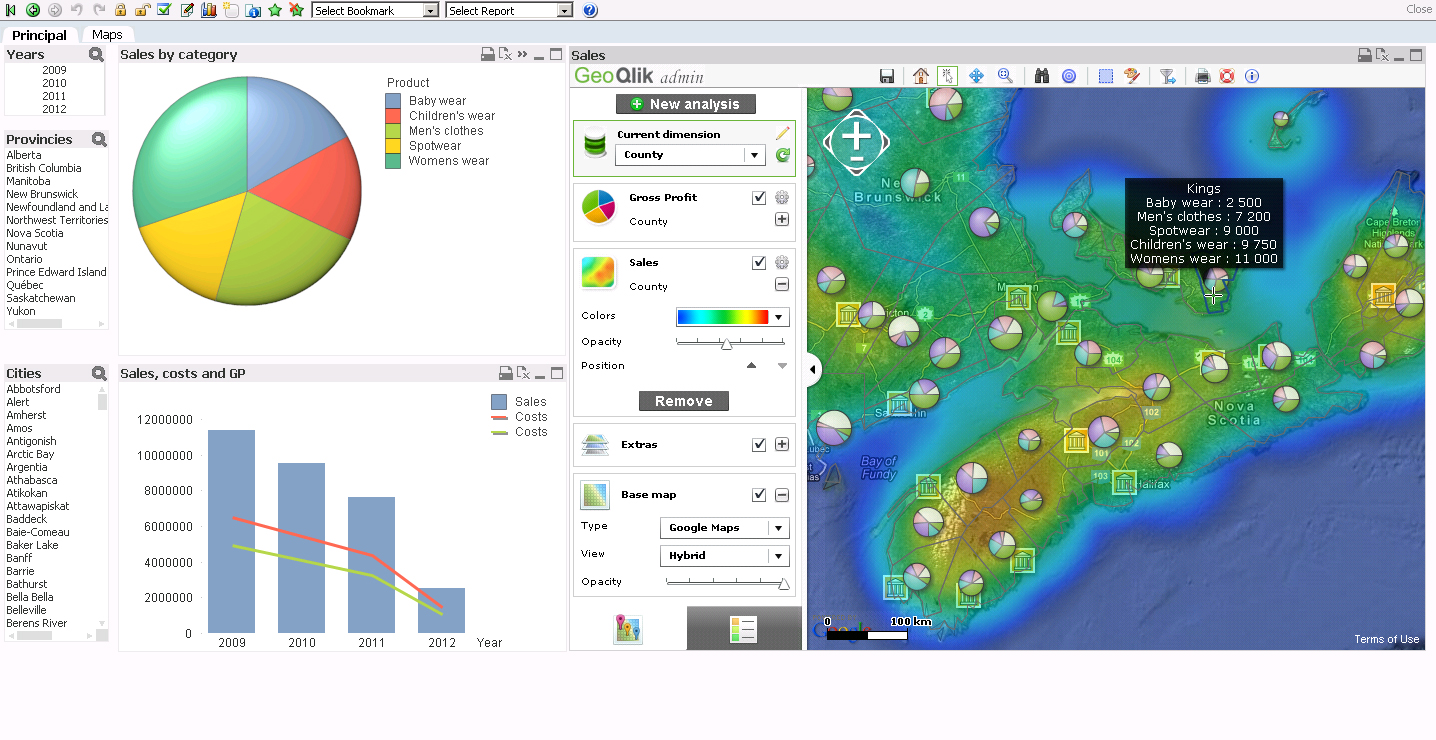
However, there are many technical limitations in using Google Maps (GMaps) to display QlikView KPI indicators. First of all, the drill-down, pan and selection capabilities are quite limited. Moreover, you cannot display several indicators at the same time and on the same map (background + foreground indicators), you are also limited to draw bubbles and therefore you cannot display pie/bar charts nor "real" heat maps. Finally, you cannot display QlikView KPIs on specific Sales/Business Areas with GMaps such as the Bricks in the Pharmaceutical sector (Brick = aggregation of zipcodes).
On top of that, there are also a few "commercial" aspects to be considered since many QlikView customers & channel partners use GMaps API "FREE" Key inside their QlikView server or rich client without complying with GMaps license terms...Indeed, for "professional internal use" (intranet, extranet or internet with username/password authentication to QlikView application), you must buy GMaps API "Premier" which costs about 10,000 $ USD per year or 8,500 euros per year + possible extra fees depending upon the total number of daily hits.
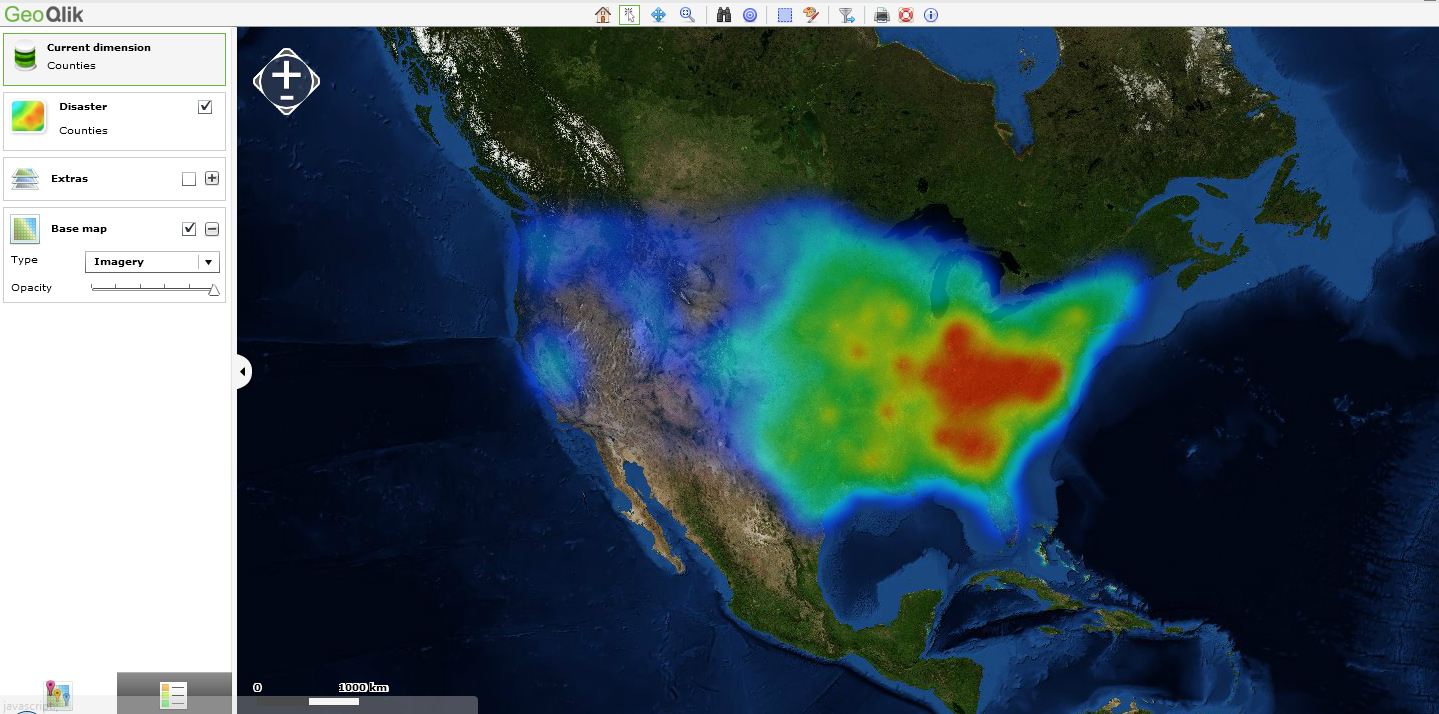
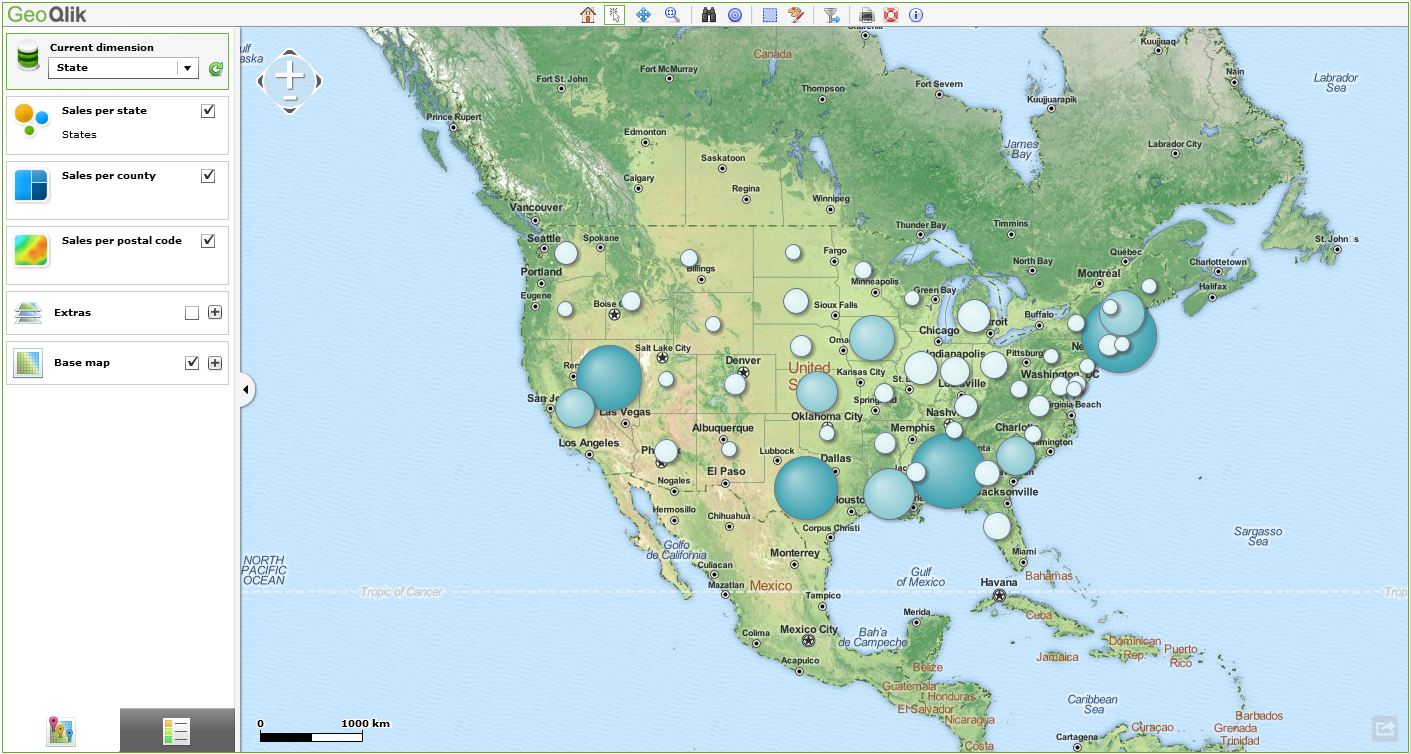
A few alternatives exist such as Open Street Map (totally FREE) or other WMS/TMS services. I hereby suggest you to have a look at our new mapping extension for QlikView 11 SR1 namely "GeoQlik v11.6":
http://www.geoqlik.com/en/geoqlik-for-qlikview/geoqlik-v11.html
Please find hereafter a few screenshots of GeoQlik V11.6 using WMS/TMS services to display QlikView KPIs:
Thanks and best regards,
David
@Business Geografic