Unlock a world of possibilities! Login now and discover the exclusive benefits awaiting you.
- Qlik Community
- :
- All Forums
- :
- QlikView App Dev
- :
- Re: Graph Problem
- Subscribe to RSS Feed
- Mark Topic as New
- Mark Topic as Read
- Float this Topic for Current User
- Bookmark
- Subscribe
- Mute
- Printer Friendly Page
- Mark as New
- Bookmark
- Subscribe
- Mute
- Subscribe to RSS Feed
- Permalink
- Report Inappropriate Content
Graph Problem
Hello,
Please help, I was wondering how to fix the graph below.
Here's my graph last January 2011
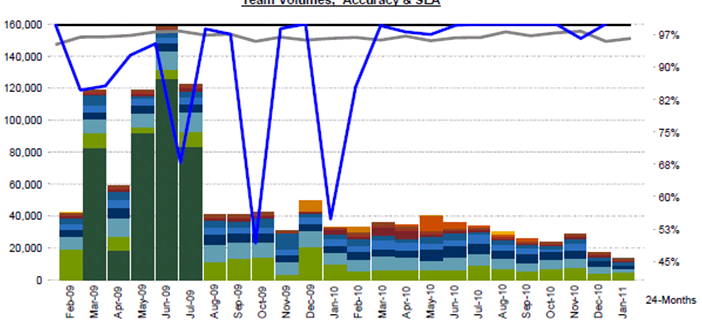
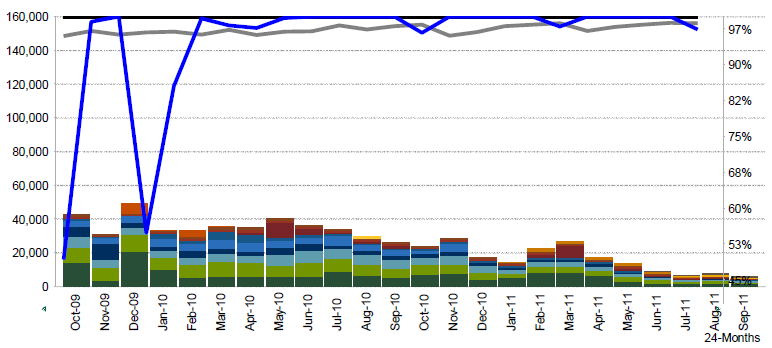
and here's my graph for this month. The scale is too high.
Here's the expressions I used
Static Max:
=ceil(max(aggr(sum([Volumes]),[MMM-YY])), pow(10,len(textbetween(round(max(aggr(sum([Volumes]),[MMM-YY]))),'','',1))-2))
Static Step:
=ceil(max(aggr(sum([Volumes]),[MMM-YY])), pow(10,len(textbetween(round(max(aggr(sum([Volumes]),[MMM-YY]))),'','',1))-2))/8
Thanks,
Salie
- Tags:
- new_to_qlikview
- Mark as New
- Bookmark
- Subscribe
- Mute
- Subscribe to RSS Feed
- Permalink
- Report Inappropriate Content
Salie
Have you checked to see what these subexpressions evaluate to?
max(aggr(sum([Volumes]),[MMM-YY]))
and
pow(10,len(textbetween(round(max(aggr(sum([Volumes]),[MMM-YY]))),'','',1))-2))
If you need to see what values are returned by the aggregation:
concat(aggr(sum([Volumes]),[MMM-YY]), ',')
Regards
Jonathan
- Mark as New
- Bookmark
- Subscribe
- Mute
- Subscribe to RSS Feed
- Permalink
- Report Inappropriate Content
Hi Jonathan,
Where should I add
concat(aggr(sum([Volumes]),[MMM-YY]), ',')?
Thanks,
Salie
- Mark as New
- Bookmark
- Subscribe
- Mute
- Subscribe to RSS Feed
- Permalink
- Report Inappropriate Content
Hi Jonathan,
Where should I add
concat(aggr(sum([Volumes]),[MMM-YY]), ',')?
Thanks,
Salie
- Mark as New
- Bookmark
- Subscribe
- Mute
- Subscribe to RSS Feed
- Permalink
- Report Inappropriate Content
Salie
Create a text box, and enter the expression in the text box. Put an = in front of the expression.
Regards
Jonathan
- Mark as New
- Bookmark
- Subscribe
- Mute
- Subscribe to RSS Feed
- Permalink
- Report Inappropriate Content
Hi,
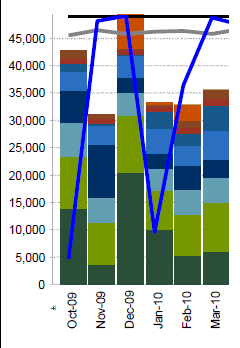
I changed my expression to your expression. It worked. The only problem I have is that I need to show '50,000' after '45,000' to make it look complete.
I place the =concat expression you have provided on both Static Step and Static Max.
thanks a lot!