Unlock a world of possibilities! Login now and discover the exclusive benefits awaiting you.
- Qlik Community
- :
- All Forums
- :
- QlikView App Dev
- :
- Graph intercept procedure
- Subscribe to RSS Feed
- Mark Topic as New
- Mark Topic as Read
- Float this Topic for Current User
- Bookmark
- Subscribe
- Mute
- Printer Friendly Page
- Mark as New
- Bookmark
- Subscribe
- Mute
- Subscribe to RSS Feed
- Permalink
- Report Inappropriate Content
Graph intercept procedure
Hi all,
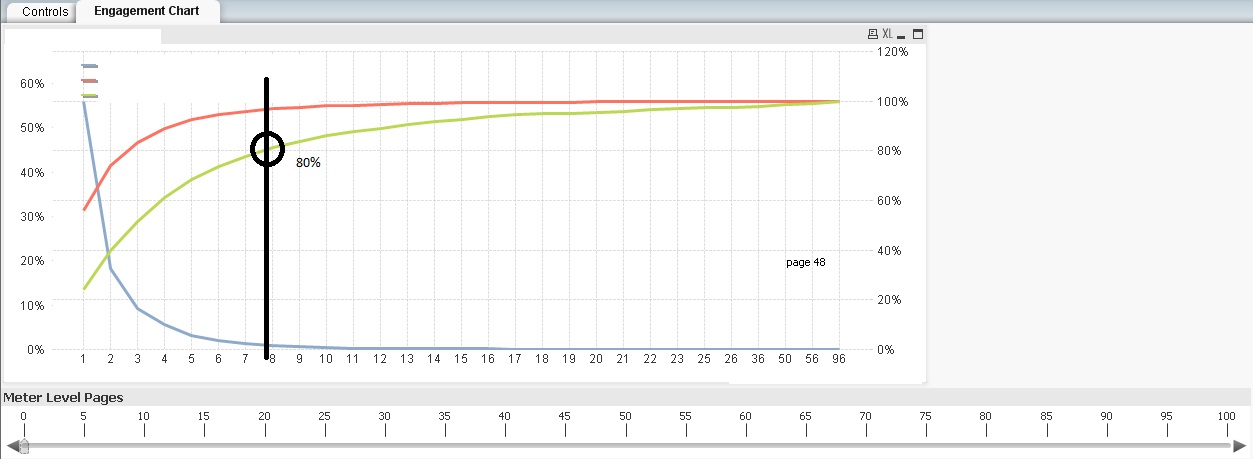
I have a graph as the one shown in the picture. The slider below the graph generates a vertical line (in black) which moves in the graph.
Can anyone help me in finding a way to retrieve the intercept value between the black line and the green curve. Is there any function I should use?
I thought that I could interpolate the greenline curve equation and calculate the Y value according to the X position of the black line, but maybe there is a easy way to get this without interpolating the green line point.
Thanks!
This is the qv file.
- Mark as New
- Bookmark
- Subscribe
- Mute
- Subscribe to RSS Feed
- Permalink
- Report Inappropriate Content
Can you post your qvw so we can take a look?
- Mark as New
- Bookmark
- Subscribe
- Mute
- Subscribe to RSS Feed
- Permalink
- Report Inappropriate Content
Hi, I have posted the file. Thanks!
- Mark as New
- Bookmark
- Subscribe
- Mute
- Subscribe to RSS Feed
- Permalink
- Report Inappropriate Content
Hi,
I think it is better to create / recreate your x-axis in the script, maybe like (untested):
INPUT:
LOAD
autonumberhash128 ( @5,@6 ) as [KeyVariable]
FROM
(txt, utf8, no labels, delimiter is '\t', msq);
OUTPUT:
LOAD
KeyVariable,
count(KeyVariable) as KVCount,
count(KeyVariable)+peek('KVCount') as KVCumCount
resident INPUT group by [KeyVariable];
I noticed that you have used an full accumulation in your graph, that's why I (tried) also to create a cumulated count.
So your expression in the text box could maybe look like:
sum(if(KVCount= scrollValue, KVCumCount)) / max(KVCumCount)
Everything untested, sorry.
Regards,
Stefan
- Mark as New
- Bookmark
- Subscribe
- Mute
- Subscribe to RSS Feed
- Permalink
- Report Inappropriate Content
Thanks a lot, it pointed me to the right direction!