Unlock a world of possibilities! Login now and discover the exclusive benefits awaiting you.
- Qlik Community
- :
- All Forums
- :
- QlikView App Dev
- :
- Re: Graph
- Subscribe to RSS Feed
- Mark Topic as New
- Mark Topic as Read
- Float this Topic for Current User
- Bookmark
- Subscribe
- Mute
- Printer Friendly Page
- Mark as New
- Bookmark
- Subscribe
- Mute
- Subscribe to RSS Feed
- Permalink
- Report Inappropriate Content
Graph
Hi All,
I want to show graph in excel. I am trying QVW SpecificationNumber showing like 881263 06 02 ,881099 05 01 . I want show SpecificationNumber 1 to 100 , 100 to 200 like graph in excel. Sort by Y-value Descending order. please give idea wich graph is better.
I am loding the data from QVD only.
I will share with you excel file , QVW file and QVD file .
Thanks
Sekhar.
Accepted Solutions
- Mark as New
- Bookmark
- Subscribe
- Mute
- Subscribe to RSS Feed
- Permalink
- Report Inappropriate Content
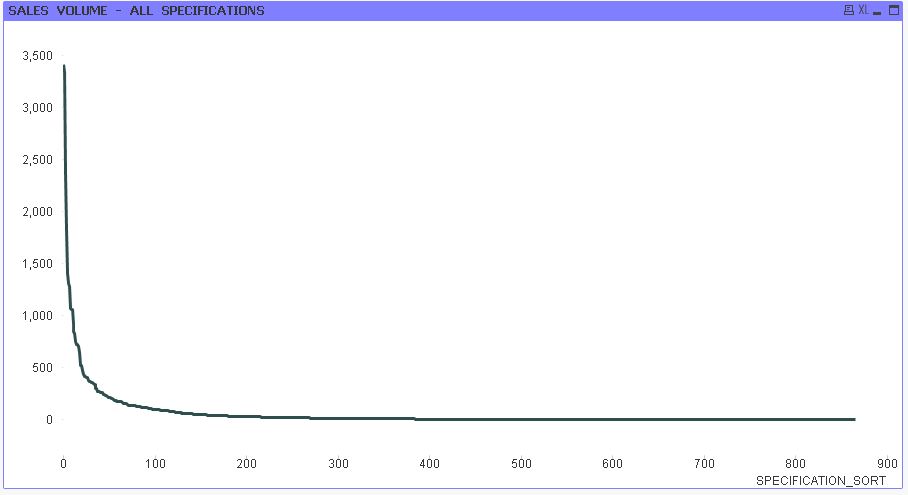
see this
Data:
LOAD ITEM_NUMBER_LOCAL,
PRODUCT,
RecNo() as Rec,
SPECIFICATION,
DRAWING_NUMBER_LOCAL,
YEAR,
QTY_SOLD
FROM
[SECONDCUT.qvd]
(qvd);
Temp:
LOAD SPECIFICATION,
sum(QTY_SOLD) as QTY_SOLD_SPEC
Resident Data
Group by SPECIFICATION
;
Drop table Temp;
Sort:
LOAD SPECIFICATION,
QTY_SOLD_SPEC,
AutoNumber(SPECIFICATION) as SPECIFICATION_SORT
Resident Temp
Order by QTY_SOLD_SPEC desc;
Dimension:
SPECIFICATION_SORT
Expression:
=sum(QTY_SOLD_SPEC)
Go to Axis tab and make the X axis continuous
- Mark as New
- Bookmark
- Subscribe
- Mute
- Subscribe to RSS Feed
- Permalink
- Report Inappropriate Content
Hi Sekhar,
Try:
Data:
LOAD
RecNo() as [Number of Specifications],
SpecificationNumber,
QtySold
FROM
[Report - Copy.xlsx]
(ooxml, embedded labels, table is [Sales Per Specification]);
then
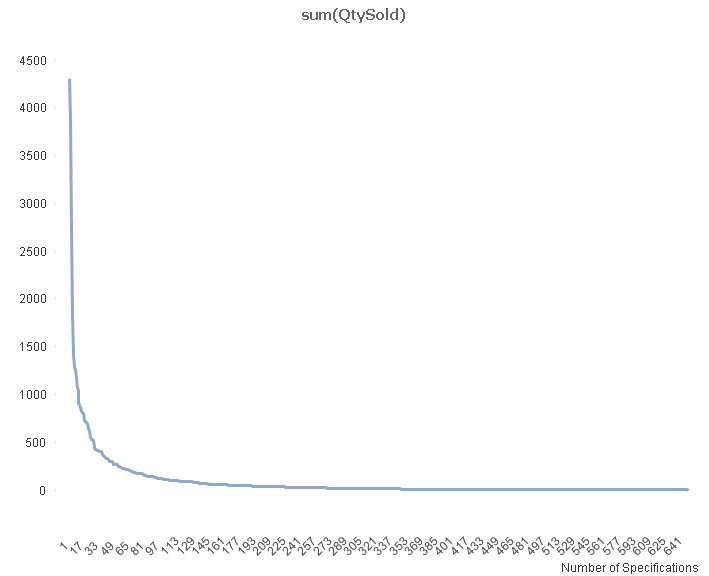
There is a trick required to show the full range of the dimension. Make the chart as a bar chart. In presentation click on Show all bars. Now change the chart type to line.
Cheers
Andrew
- Mark as New
- Bookmark
- Subscribe
- Mute
- Subscribe to RSS Feed
- Permalink
- Report Inappropriate Content
see this
Data:
LOAD ITEM_NUMBER_LOCAL,
PRODUCT,
RecNo() as Rec,
SPECIFICATION,
DRAWING_NUMBER_LOCAL,
YEAR,
QTY_SOLD
FROM
[SECONDCUT.qvd]
(qvd);
Temp:
LOAD SPECIFICATION,
sum(QTY_SOLD) as QTY_SOLD_SPEC
Resident Data
Group by SPECIFICATION
;
Drop table Temp;
Sort:
LOAD SPECIFICATION,
QTY_SOLD_SPEC,
AutoNumber(SPECIFICATION) as SPECIFICATION_SORT
Resident Temp
Order by QTY_SOLD_SPEC desc;
Dimension:
SPECIFICATION_SORT
Expression:
=sum(QTY_SOLD_SPEC)
Go to Axis tab and make the X axis continuous
- Mark as New
- Bookmark
- Subscribe
- Mute
- Subscribe to RSS Feed
- Permalink
- Report Inappropriate Content
kulasekhar did you get the answer?