Unlock a world of possibilities! Login now and discover the exclusive benefits awaiting you.
- Qlik Community
- :
- All Forums
- :
- QlikView App Dev
- :
- Grid Chart with 3 dimensions - wrong data values
- Subscribe to RSS Feed
- Mark Topic as New
- Mark Topic as Read
- Float this Topic for Current User
- Bookmark
- Subscribe
- Mute
- Printer Friendly Page
- Mark as New
- Bookmark
- Subscribe
- Mute
- Subscribe to RSS Feed
- Permalink
- Report Inappropriate Content
Grid Chart with 3 dimensions - wrong data values
I'm building a Grid Chart with three dimensions to show events across a time period
- Month Year
- Program
- The third dimension is an event that should show up based on the Month Year
The expression I used is a dummy - sum of a measure that has no relevance but is required for the dots to show up.
My problem is that the grid chart is inconsistent. When I select one program, the events are accurate, but when I filter a particular year, the events turn blank even though they are colored with the right description.
This is the data used for the chart( I combined all events in one month into one row):
| Program | Event | Event Date | Value |
| PROG1 | EV1 | 4/12/2017 | 10000 |
| PROG1 | EV2 | 7/11/2018 | 10000 |
| PROG1 | EV3 | 8/15/2018 | 10000 |
| PROG1 | EV4 | 1/1/2020 | 10000 |
| PROG1 | EV5 | 1/29/2020 | 20000 |
| PROG1 | EV6 | 1/31/2020 | 20000 |
When the Program is selected, the events are displayed correctly.
For Year 2017 - Correct event
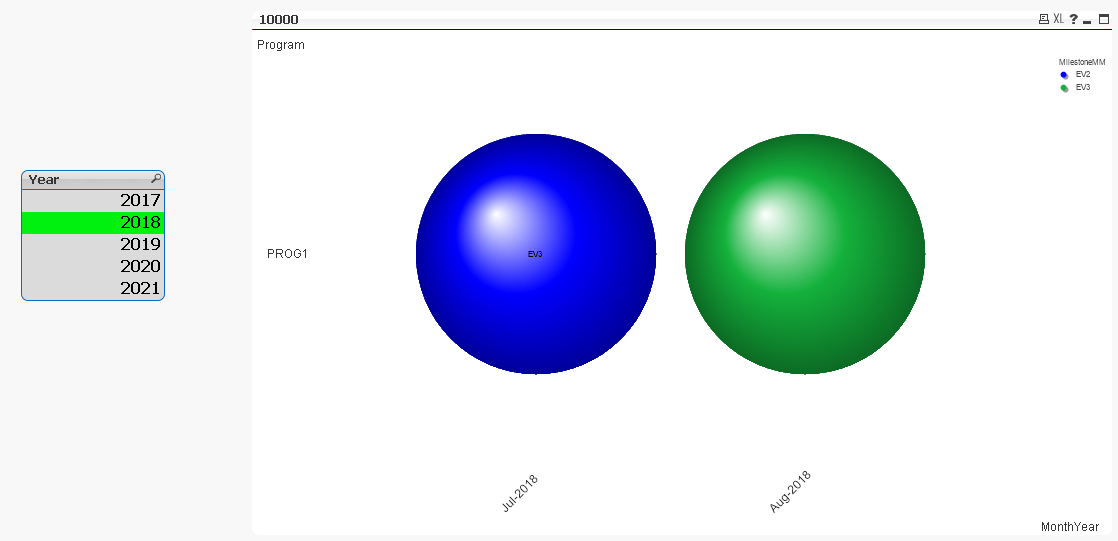
For Year 2018 - The event is mixed up and one event is not displayed
For Year 2020 - The event is not displayed at all.
I have done a join with one Master Calendar ( Year Month) with the events table (Year MonthKey). I then use MonthYear as a dimension. It seems straightforward , but any filter messes up the data. Any ideas on what I am doing wrong here?
- Mark as New
- Bookmark
- Subscribe
- Mute
- Subscribe to RSS Feed
- Permalink
- Report Inappropriate Content
You likely need to attach the QVW so folks can have a look at your data model as well as the chart settings in order to try to help you as without that info, they would be shooting in the dark to a large degree, which I suspect is why you have not received any responses as yet.
Regards,
Brett
I now work a compressed schedule, Tuesday, Wednesday and Thursday, so those will be the days I will reply to any follow-up posts.
- Mark as New
- Bookmark
- Subscribe
- Mute
- Subscribe to RSS Feed
- Permalink
- Report Inappropriate Content
See duplicate post: https://community.qlik.com/t5/QlikView-App-Development/Grid-chart-Wrong-data-on-data-point-labels/m-...
Regards,
Brett
I now work a compressed schedule, Tuesday, Wednesday and Thursday, so those will be the days I will reply to any follow-up posts.