Unlock a world of possibilities! Login now and discover the exclusive benefits awaiting you.
Announcements
FLASH SALE: Save $500! Use code FLASH2026 at checkout until Feb 14th at 11:59PM ET. Register Now!
- Qlik Community
- :
- All Forums
- :
- QlikView App Dev
- :
- Grid chart bubble size
Options
- Subscribe to RSS Feed
- Mark Topic as New
- Mark Topic as Read
- Float this Topic for Current User
- Bookmark
- Subscribe
- Mute
- Printer Friendly Page
Turn on suggestions
Auto-suggest helps you quickly narrow down your search results by suggesting possible matches as you type.
Showing results for
Specialist
2018-01-14
02:30 PM
- Mark as New
- Bookmark
- Subscribe
- Mute
- Subscribe to RSS Feed
- Permalink
- Report Inappropriate Content
Grid chart bubble size
Hi,
I have to create a chart that looks like the following:
Each bubble represents a project.
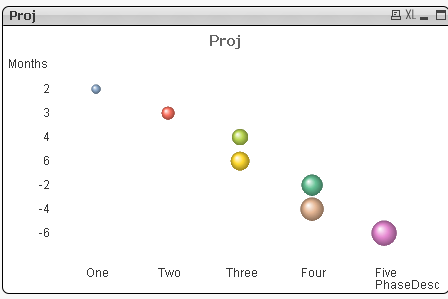
The bubble size should be by the Cost field. But it is not correct in the chart.
Attached are my data.
Would appreciate some guidelines..
Thanks!
1,677 Views
1 Solution
Accepted Solutions
Partner - Specialist
2018-01-15
03:36 AM
- Mark as New
- Bookmark
- Subscribe
- Mute
- Subscribe to RSS Feed
- Permalink
- Report Inappropriate Content
3 Replies
Partner - Specialist
2018-01-15
03:36 AM
- Mark as New
- Bookmark
- Subscribe
- Mute
- Subscribe to RSS Feed
- Permalink
- Report Inappropriate Content
Hi Dafnis,
Hope below is what you want.
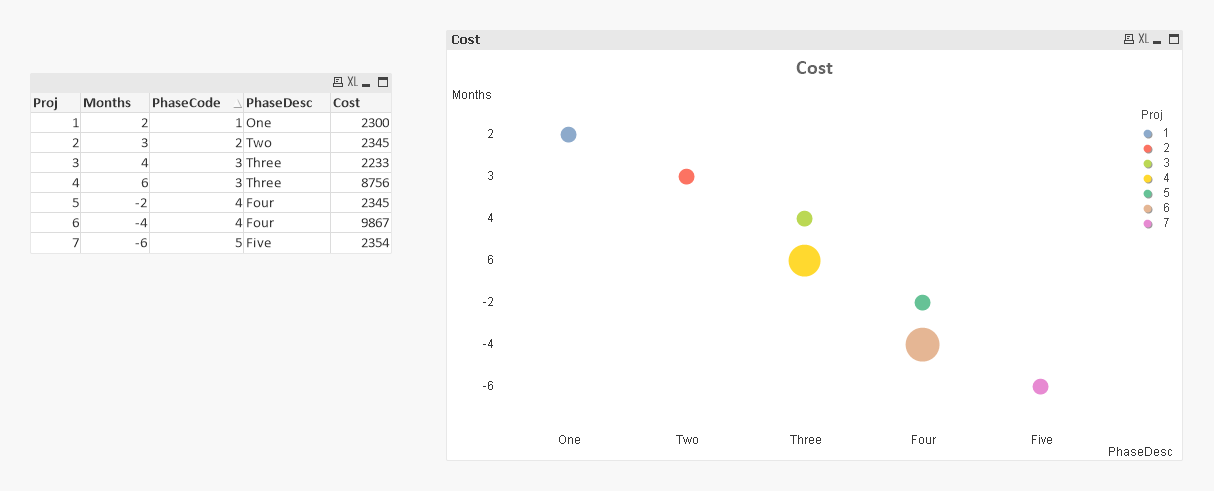
Thanks.
Aiolos
Specialist
2018-01-15
03:44 AM
Author
- Mark as New
- Bookmark
- Subscribe
- Mute
- Subscribe to RSS Feed
- Permalink
- Report Inappropriate Content
Dear Aiolos,
You made my day!
Thanks!
1,529 Views
Partner - Specialist
2018-01-15
03:48 AM
- Mark as New
- Bookmark
- Subscribe
- Mute
- Subscribe to RSS Feed
- Permalink
- Report Inappropriate Content
Glad to help you~
Aiolos
1,529 Views