Unlock a world of possibilities! Login now and discover the exclusive benefits awaiting you.
- Qlik Community
- :
- All Forums
- :
- QlikView App Dev
- :
- Re: Re: Group By in Qlikview
- Subscribe to RSS Feed
- Mark Topic as New
- Mark Topic as Read
- Float this Topic for Current User
- Bookmark
- Subscribe
- Mute
- Printer Friendly Page
- Mark as New
- Bookmark
- Subscribe
- Mute
- Subscribe to RSS Feed
- Permalink
- Report Inappropriate Content
Group By in Qlikview
Hi All
I have data in the following format
| catalog# | area | Sales | Qty |
| 32B567H | P | $100 | 34 |
| 32B567H | Q | $200 | 12 |
| 32B567H | R | $250 | 56 |
| 32B567H | S | $550 | 21 |
If you calculate the average price for each row, it will look like this
| avg price |
| $ 2.94 |
| $ 16.67 |
| $ 4.46 |
| $ 26.19 |
Now the requirement is to display the Min and Max Average price for each catalog#
| catalog# | Total Sales | Total Qty | Avg Price | max | min |
| 32B567H | $ 1,100 | 123 | $ 8.94 | $ 26.19 | $ 2.94 |
In SQL terms, I have to calculate the Min and Max Average, grouped by Catalog# and Area
How do I achieve this in Qlikview expression? Please advise
- « Previous Replies
- Next Replies »
- Mark as New
- Bookmark
- Subscribe
- Mute
- Subscribe to RSS Feed
- Permalink
- Report Inappropriate Content
And there is a List Box to select the Area... so the calculation has to be as per the Area selected.
- Mark as New
- Bookmark
- Subscribe
- Mute
- Subscribe to RSS Feed
- Permalink
- Report Inappropriate Content
You can use Aggr function...
- Mark as New
- Bookmark
- Subscribe
- Mute
- Subscribe to RSS Feed
- Permalink
- Report Inappropriate Content
Take a straight table,
dimension1: catalog#
dimension2: Area //(if needed)
Expressions: Min(Sales), Max(Sales), Avg(Sales)
- Mark as New
- Bookmark
- Subscribe
- Mute
- Subscribe to RSS Feed
- Permalink
- Report Inappropriate Content
Paramita - Try the below script:
LOAD
catalog#,
area,
Min([avg price]) AS Min_Avg_Price,
Max([avg price]) AS Min_Avg_Price
From [YourTableName]
Group by catalog#, area;
DV
www.QlikShare.com
- Mark as New
- Bookmark
- Subscribe
- Mute
- Subscribe to RSS Feed
- Permalink
- Report Inappropriate Content
Tresesco
This doesnot work. I need Min and Max of Average and without displaying the area.
- Mark as New
- Bookmark
- Subscribe
- Mute
- Subscribe to RSS Feed
- Permalink
- Report Inappropriate Content
DV
I dont have the avergae price in the source data. I have to calculate it and then take the max and min.
Can this be done in an expression or it has to be handled in a script ?
- Mark as New
- Bookmark
- Subscribe
- Mute
- Subscribe to RSS Feed
- Permalink
- Report Inappropriate Content
Temp:
Load *, Sales/Qty as Avg Inline
[
catalog#, area, Sales, Qty
32B567H, P, 100, 34
32B567H, Q, 200, 12
32B567H, R, 250, 56
32B567H, S, 550, 21
];
Final:
Load catalog#, SUM(Sales) as [Total Sales], SUM(Qty) as [Total Qty], SUM(Sales)/SUM(Qty) as [Avg Price] Resident Temp Group By catalog#;
Join
Load catalog#, Max(Avg) as MaxAvg, Min(Avg) as MinAvg Resident Temp Group By catalog#;
Drop Table Temp;
- Mark as New
- Bookmark
- Subscribe
- Mute
- Subscribe to RSS Feed
- Permalink
- Report Inappropriate Content
Hi,
Try with this it is working correctly.
Temp:
Load * Inline
[
catalog#, area, Sales, Qty
32B567H, P, 100, 34
32B567H, Q, 200, 12
32B567H, R, 250, 56
32B567H, S, 550, 21
];
Take a Straight table
Add dimension as catalog#
in the Expressions-
First Expression -sum(Sales) and Rename it as [Total sales]
Second Expression - sum(Qty) and Rename it as [Total Qty]
Third Expression - [Total sales]/[Total Qty] -------Avg
Fourth Expression - min(Aggr(Sales,area)/Aggr(Qty,area)) ---------Min Avg
Fifth Expression - max(Aggr(Sales,area)/Aggr(Qty,area)) ---------Max Avg
- Mark as New
- Bookmark
- Subscribe
- Mute
- Subscribe to RSS Feed
- Permalink
- Report Inappropriate Content
Hi Karthigayan
With your approach this is what I get
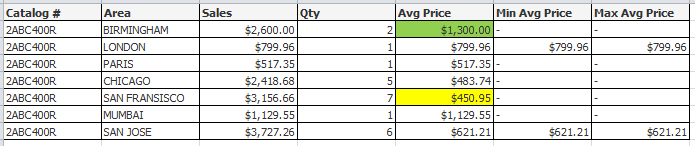
I would want the highlighted values i.e $450.45 to appear under Min Avg Price and $1300 under Max Avg Price.
Looks like I will have to use a temp table in scritping to achieve this.
- « Previous Replies
- Next Replies »