Unlock a world of possibilities! Login now and discover the exclusive benefits awaiting you.
- Qlik Community
- :
- All Forums
- :
- QlikView App Dev
- :
- Re: Group bar chart
- Subscribe to RSS Feed
- Mark Topic as New
- Mark Topic as Read
- Float this Topic for Current User
- Bookmark
- Subscribe
- Mute
- Printer Friendly Page
- Mark as New
- Bookmark
- Subscribe
- Mute
- Subscribe to RSS Feed
- Permalink
- Report Inappropriate Content
Group bar chart
Hi,
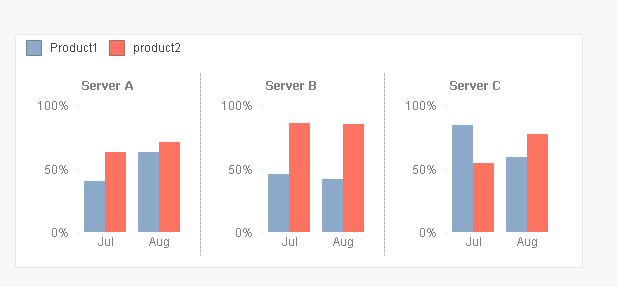
I created one application(attached) based on attached(jpeg). I want to get individual server wise BAR for each month in each product(attribute). Whenever trying to do it its coming stack kind of chart.
As well as i want show the selected month as well as previous 4 months of the selected one. My smaple data contains 2 monts data.
But requesting you to help me how to create this kind of graph
- « Previous Replies
-
- 1
- 2
- Next Replies »
- Mark as New
- Bookmark
- Subscribe
- Mute
- Subscribe to RSS Feed
- Permalink
- Report Inappropriate Content
Hi,
I have tried to replicate the Chart and it seems to be a limitation with the bar chart that after a certain amount of dimensions it automatically stacks the chart.
Making an extension maybe the only option.
Sorry I couldn't be more help.
Mark
- Mark as New
- Bookmark
- Subscribe
- Mute
- Subscribe to RSS Feed
- Permalink
- Report Inappropriate Content
Thank you Mark. Appreciate your help.
- Mark as New
- Bookmark
- Subscribe
- Mute
- Subscribe to RSS Feed
- Permalink
- Report Inappropriate Content
When have more than two dimension in bar chart, it automatically converts into stack.
You can show the charts in two ways, which is not exactly what you are looking for but another way to display
Please see the attached
- Mark as New
- Bookmark
- Subscribe
- Mute
- Subscribe to RSS Feed
- Permalink
- Report Inappropriate Content
ok got it but it is not good to show more than 100% in the axis. Any one can confused at first glance.
really a bad feature.
- Mark as New
- Bookmark
- Subscribe
- Mute
- Subscribe to RSS Feed
- Permalink
- Report Inappropriate Content
Go to Chart Properties-> Axis Tab ->
check Static Min and set Value 0
Static Max = 1
Static step =0.25
- Mark as New
- Bookmark
- Subscribe
- Mute
- Subscribe to RSS Feed
- Permalink
- Report Inappropriate Content
try with a trellis in dimension tab
- Mark as New
- Bookmark
- Subscribe
- Mute
- Subscribe to RSS Feed
- Permalink
- Report Inappropriate Content
could you share the sample qvw?
- Mark as New
- Bookmark
- Subscribe
- Mute
- Subscribe to RSS Feed
- Permalink
- Report Inappropriate Content
requesting you share the sample application
- Mark as New
- Bookmark
- Subscribe
- Mute
- Subscribe to RSS Feed
- Permalink
- Report Inappropriate Content
PFA
- « Previous Replies
-
- 1
- 2
- Next Replies »