Unlock a world of possibilities! Login now and discover the exclusive benefits awaiting you.
- Qlik Community
- :
- All Forums
- :
- QlikView App Dev
- :
- Re: Group by in qlikview and calculation on groupb...
- Subscribe to RSS Feed
- Mark Topic as New
- Mark Topic as Read
- Float this Topic for Current User
- Bookmark
- Subscribe
- Mute
- Printer Friendly Page
- Mark as New
- Bookmark
- Subscribe
- Mute
- Subscribe to RSS Feed
- Permalink
- Report Inappropriate Content
Group by in qlikview and calculation on groupby
Hi All
What does group by does
Will it consider set of rows as 1 row
I have a situation where
Employee id, employee name, age, sur_name, country, orders
1 bond 26 james usa 200 $
3 bond 26 james canada 500$
2 lisa 22 ray russia 20$
2 lisa 22 ray russia 40$
My question is if Employee id, employee name, age, sur_name, country, is same expect orders
consider it as one id and the total orders is sum of both the rows ie 60 $.
if any value in Employee id, employee name, age, sur_name, country, is different consider it as different record
the output in the above senario is
Employee id total orders
1 200$
2 60$
3 500$
can we achieve it by any aggr function or group by in the script
- « Previous Replies
-
- 1
- 2
- Next Replies »
Accepted Solutions
- Mark as New
- Bookmark
- Subscribe
- Mute
- Subscribe to RSS Feed
- Permalink
- Report Inappropriate Content
Hi John,
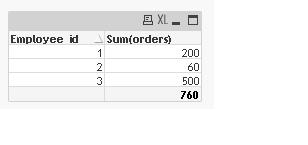
Use simple straight chart and apply following
Dimension:- Employee id
Expression:- Sum(orders)& '$'
you will get below table from that :
| Employee id | Total Orders |
|---|---|
| 1 | 200$ |
| 2 | 60$ |
| 3 | 500$ |
Else you can use aggregate function also as following:
Dimension:- Employee id
Expression:- aggr(Sum(orders)& '$',age,country,[employee name],sur_name)
you will get below table from that :
| Employee id | Total Orders |
|---|---|
| 1 | 200$ |
| 2 | 60$ |
| 3 | 500$ |
Thanks,
- Mark as New
- Bookmark
- Subscribe
- Mute
- Subscribe to RSS Feed
- Permalink
- Report Inappropriate Content
try like this:
dimension: Employee id
expression: aggr(sum(orders),[employee name],sur_name,country,age)
hope this helps
- Mark as New
- Bookmark
- Subscribe
- Mute
- Subscribe to RSS Feed
- Permalink
- Report Inappropriate Content
Hi,
I believe if you create a simple report with Employee id and total Orders, you will receive it.
Yes, you can group by in script, please see the below.
Load Employee id, Employee name,age,sur_name,country , sum(total ordere)
From File
Group by Employee id, Employee name,age,sur_name,country;
Regards,
Nimesh Krishnan L
- Mark as New
- Bookmark
- Subscribe
- Mute
- Subscribe to RSS Feed
- Permalink
- Report Inappropriate Content
Try like this
Dimension is employee id
Expression is
Sum(<[employee id]> total bond)
- Mark as New
- Bookmark
- Subscribe
- Mute
- Subscribe to RSS Feed
- Permalink
- Report Inappropriate Content
You can do this in couple of ways as below:
Option I:
Just load your data and create a straight table as below:
Dimension: Employee_Id
Expression: Sum(Orders)
Option II:
If you want to use group by in the script then follow as below:
Source_Data:
Load [Employee_id], [Employee name],[age],[sur_name],[country], sum(orders)
Group by [Employee_id], [Employee name],age,sur_name,country;
LOAD * INLINE [
Employee_id, Employee name, age, sur_name, country, orders
1, bond, 26, james, usa, 200
3, bond, 26, james, canada, 500
2, lisa, 22, ray, russia, 20
2, lisa, 22, ray, russia, 40
];
Note: You can use group by only on the Resident table.
- Mark as New
- Bookmark
- Subscribe
- Mute
- Subscribe to RSS Feed
- Permalink
- Report Inappropriate Content
Hi cena,
You can do it in script itself
Load
Employee id,
employee name,
age,
sur_name,
country,
orders,
sum(orders) as TotalOrders
resident Table name
group by
Employee id, employee name,age,sur_name,country,orders;
Drop Table Table name;
- Mark as New
- Bookmark
- Subscribe
- Mute
- Subscribe to RSS Feed
- Permalink
- Report Inappropriate Content
Hi John,
Use simple straight chart and apply following
Dimension:- Employee id
Expression:- Sum(orders)& '$'
you will get below table from that :
| Employee id | Total Orders |
|---|---|
| 1 | 200$ |
| 2 | 60$ |
| 3 | 500$ |
Else you can use aggregate function also as following:
Dimension:- Employee id
Expression:- aggr(Sum(orders)& '$',age,country,[employee name],sur_name)
you will get below table from that :
| Employee id | Total Orders |
|---|---|
| 1 | 200$ |
| 2 | 60$ |
| 3 | 500$ |
Thanks,
- Mark as New
- Bookmark
- Subscribe
- Mute
- Subscribe to RSS Feed
- Permalink
- Report Inappropriate Content
Hi Frank,
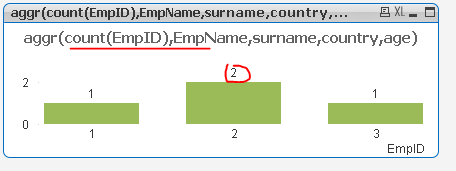
what about the count, if i want to calculate the count of employee id based on the same senario, its not giving me correct results can you pls guide me
- Mark as New
- Bookmark
- Subscribe
- Mute
- Subscribe to RSS Feed
- Permalink
- Report Inappropriate Content
what would be the expected output?
- Mark as New
- Bookmark
- Subscribe
- Mute
- Subscribe to RSS Feed
- Permalink
- Report Inappropriate Content
can u place the qvw please
- « Previous Replies
-
- 1
- 2
- Next Replies »