Unlock a world of possibilities! Login now and discover the exclusive benefits awaiting you.
Announcements
Save $650 on Qlik Connect, Dec 1 - 7, our lowest price of the year. Register with code CYBERWEEK: Register
- Qlik Community
- :
- All Forums
- :
- QlikView App Dev
- :
- Re: Group two columns to discover relationship
Options
- Subscribe to RSS Feed
- Mark Topic as New
- Mark Topic as Read
- Float this Topic for Current User
- Bookmark
- Subscribe
- Mute
- Printer Friendly Page
Turn on suggestions
Auto-suggest helps you quickly narrow down your search results by suggesting possible matches as you type.
Showing results for
Contributor III
2017-03-06
02:52 PM
- Mark as New
- Bookmark
- Subscribe
- Mute
- Subscribe to RSS Feed
- Permalink
- Report Inappropriate Content
Group two columns to discover relationship
Dear all,
I have one table, with some columns, but I have two columns with names, I need discover relationship between these columns. I've tried but I cant display the data in one single table in an appropriate layout ou graph.
My main table is something like that:
| NAME1 | NAME2 |
| A | N1 |
| B | N2 |
| C | N3 |
| D | N3 |
| E | N1 |
| F | N4 |
| G | N2 |
| H | A |
| I | A |
| J | N5 |
| K | N1 |
| L | B |
| M | A |
| B | C |
| A | E |
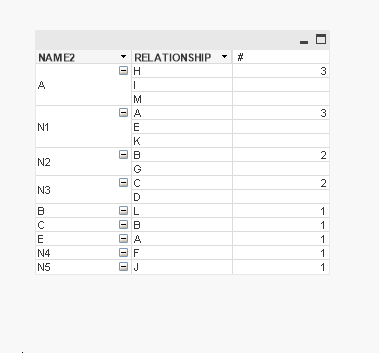
I need a result like that: (the display order must be based on number of relationship + name)
| Result | ||
| NAME2 | RELATIONSHIP | Number of relations |
| A | H | 3 |
| I | ||
| M | ||
| N1 | A | 3 |
| E | ||
| K | ||
| N2 | B | 2 |
| G | ||
| N3 | C | 2 |
| D | ||
| B | L | 1 |
| C | B | 1 |
| E | A | 1 |
| N4 | F | 1 |
| N5 | J | 1 |
Thanks!
512 Views
2 Replies
MVP
2017-03-06
03:06 PM
- Mark as New
- Bookmark
- Subscribe
- Mute
- Subscribe to RSS Feed
- Permalink
- Report Inappropriate Content
this is a pivot with 2 dimensions NAME2 NAME1
and as expression count(TOTAL <NAME2> NAME1)
text color for expression is if(rowno()<>1, white())
sort is

Contributor III
2017-03-06
07:24 PM
Author
- Mark as New
- Bookmark
- Subscribe
- Mute
- Subscribe to RSS Feed
- Permalink
- Report Inappropriate Content
Nice job ! Thanks for help! Works fine ! 🙂
441 Views