Unlock a world of possibilities! Login now and discover the exclusive benefits awaiting you.
- Qlik Community
- :
- All Forums
- :
- QlikView App Dev
- :
- Grouping parts of dimensions as other in pivot tab...
- Subscribe to RSS Feed
- Mark Topic as New
- Mark Topic as Read
- Float this Topic for Current User
- Bookmark
- Subscribe
- Mute
- Printer Friendly Page
- Mark as New
- Bookmark
- Subscribe
- Mute
- Subscribe to RSS Feed
- Permalink
- Report Inappropriate Content
Grouping parts of dimensions as other in pivot tables
Hi,
I have a problem with grouping a customer dimension in a other post in my sales forecast pivot tables. I always want to keep the same 9 customers + an other post with the rest customers in my pivots.
In stacked bar charts I can do this by limiting the customer in the presentation tab. The same with pie charts where I both can limit the number of slices or set a percentage as gate.
How can I do this in the best way for pivot tables?
Thanks for your help
- Mark as New
- Bookmark
- Subscribe
- Mute
- Subscribe to RSS Feed
- Permalink
- Report Inappropriate Content
The suggestions and solution in this thread should help you:
- Mark as New
- Bookmark
- Subscribe
- Mute
- Subscribe to RSS Feed
- Permalink
- Report Inappropriate Content
Hi Jason,
Yes, I saw this thread but the difference is that I don't want unselected customers to be grouped into others. I want a defined subset of the selected customer to be grouped into others.
- Mark as New
- Bookmark
- Subscribe
- Mute
- Subscribe to RSS Feed
- Permalink
- Report Inappropriate Content
How do you define which customers are in the subset of currently selected customers?
- Mark as New
- Bookmark
- Subscribe
- Mute
- Subscribe to RSS Feed
- Permalink
- Report Inappropriate Content
Either a pre-defined number of customer's (Key customers) and the rest is others or by size. Example; everything below X USD per year is grouped to others.
- Mark as New
- Bookmark
- Subscribe
- Mute
- Subscribe to RSS Feed
- Permalink
- Report Inappropriate Content
If the pre-defined list is not dependent on user selections, then flagging them in the script is probably the best way forward.
Can you provide an example of a list of customers and how you want them group on a chart as I'm not sure I follow.
Jason
- Mark as New
- Bookmark
- Subscribe
- Mute
- Subscribe to RSS Feed
- Permalink
- Report Inappropriate Content
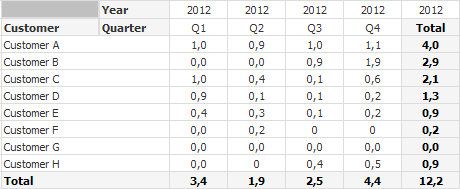
The table below is a typical example how it looks today.Customer A-D I want to display as is and customer E-H grouped as others without making any selections in the cuustomer field.

- Mark as New
- Bookmark
- Subscribe
- Mute
- Subscribe to RSS Feed
- Permalink
- Report Inappropriate Content
Sorry for the delay mate - I've been swamped lately! I'll try and revisit this today for you.
Jason