Unlock a world of possibilities! Login now and discover the exclusive benefits awaiting you.
- Qlik Community
- :
- All Forums
- :
- QlikView App Dev
- :
- Re: Guage charts overlap
- Subscribe to RSS Feed
- Mark Topic as New
- Mark Topic as Read
- Float this Topic for Current User
- Bookmark
- Subscribe
- Mute
- Printer Friendly Page
- Mark as New
- Bookmark
- Subscribe
- Mute
- Subscribe to RSS Feed
- Permalink
- Report Inappropriate Content
Guage charts overlap
Hi All
I have a stuck from here regarding gauge chart to show indicator for relevant year i not understood i would do.
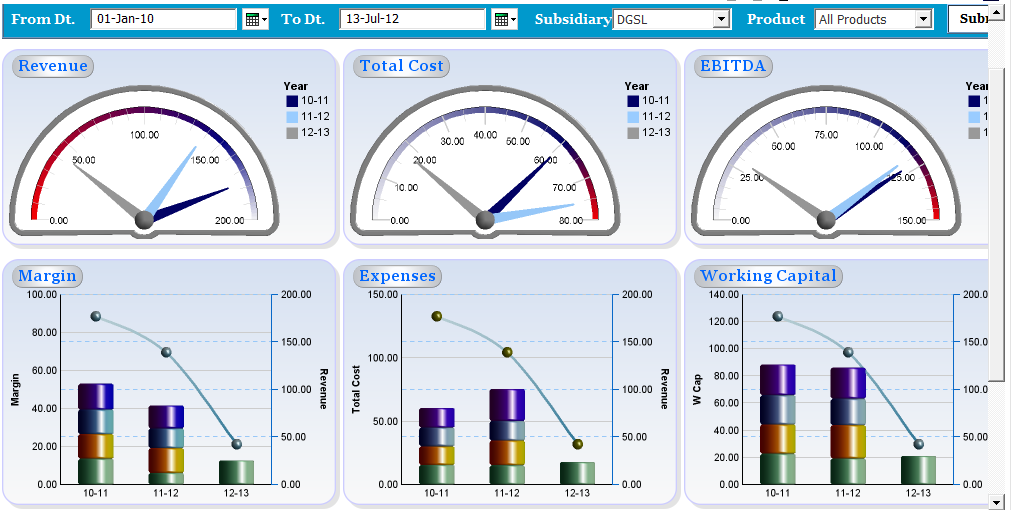
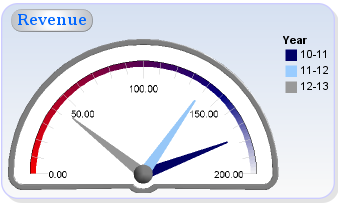
fiscal_year is the dimension sum(revenue) is my measure any body try like which i am share screen shot and let me know immediately this for immediate requirement.
i will appreciate who ever given reputed answer or else similar to alternate in same gauge chart.
- Mark as New
- Bookmark
- Subscribe
- Mute
- Subscribe to RSS Feed
- Permalink
- Report Inappropriate Content
if the problem is to have multiple needles for each gauges
Re: Multiple needles in gauge chart (tachometer)
gauge doesn't have dimension, only one expression
- Mark as New
- Bookmark
- Subscribe
- Mute
- Subscribe to RSS Feed
- Permalink
- Report Inappropriate Content
You can however overlap mutliple gauges to show different years or use reference lines. If overlapping you would set the overlapping gauge to transparent.
- Mark as New
- Bookmark
- Subscribe
- Mute
- Subscribe to RSS Feed
- Permalink
- Report Inappropriate Content
Create 3 gauge charts for 3 years seperately (remember you can use the specific year in expressions as there is no dimension in gauge chart)
sum({<year='2010'>}revenue) - Use show scale, show needle, speedometer, define 2-3 segments for different colors, in colors tab give a different color (grey)
sum({<year='2011'>}revenue) - Uncheck "show scale", show needle, Hide segment boundaries, hide gauge outlines, in colors tab give a different color (dark blue)
sum({<year='2012'>}revenue) - Uncheck "show scale", show needle, Hide segment boundaries, hide gauge outlines, in colors tab give a different color (light blue)
Define layout in each chart like 5,10,15 for charts with year 2010, 2011, 2012 respectively
Now overlap the charts for 2011 and 2012 over 2010 after making proper layout .
For legends you have to create text box only for the desired year range and color box.
Hope that will help.