Unlock a world of possibilities! Login now and discover the exclusive benefits awaiting you.
- Qlik Community
- :
- All Forums
- :
- QlikView App Dev
- :
- Re: HELP! Aggregate a Subset of a Deminsion
- Subscribe to RSS Feed
- Mark Topic as New
- Mark Topic as Read
- Float this Topic for Current User
- Bookmark
- Subscribe
- Mute
- Printer Friendly Page
- Mark as New
- Bookmark
- Subscribe
- Mute
- Subscribe to RSS Feed
- Permalink
- Report Inappropriate Content
HELP! Aggregate a Subset of a Deminsion
Please help I have a simple list of Helpdesk Tickets where I am trying to determine % of Tickets Open 1 day or less, % of Tickets Open 2 - 5 days etc. I can not seem to get an expression to work where the Count of "Tickets Open" = 1 / Count of "Ticket # gives me a %. Syntax for this is very frustrating given I can handle simple math / algebra.
| Ticket # | Days Open |
| 19821 | 1 |
| 19822 | 1 |
| 19824 | 1 |
| 19825 | 1 |
| 19826 | 1 |
| 19827 | 3 |
| 19828 | 4 |
| 19829 | 4 |
| 19831 | 4 |
| 19832 | 5 |
| 19833 | 5 |
| 19834 | 5 |
| 19837 | 6 |
| 19838 | 6 |
| 19841 | 8 |
| 19842 | 9 |
- « Previous Replies
-
- 1
- 2
- Next Replies »
Accepted Solutions
- Mark as New
- Bookmark
- Subscribe
- Mute
- Subscribe to RSS Feed
- Permalink
- Report Inappropriate Content
Hi,
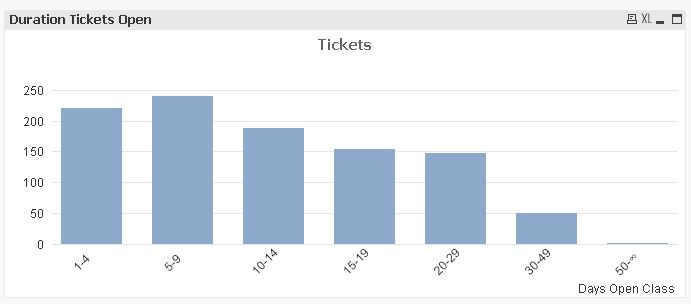
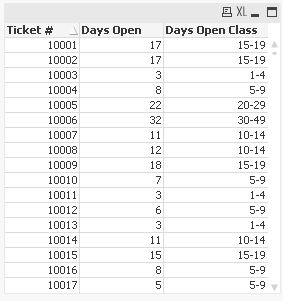
for unequal sized buckets another solution could be:
tabTickets:
LOAD 10000+RecNo() as [Ticket #],
    Ceil(NORMINV((Rand()+1)/2,0,15)) as [Days Open]
AutoGenerate 1000;

tabOpenClass:
LOAD RangeMin,
    Alt(Peek(RangeMin)-1, Dual('∞', 100000000000000)) as RangeMax
Inline [
RangeMin
50
30
20
15
10
5
1
];

Left Join (tabTickets)
IntervalMatch ([Days Open])
LOAD RangeMin, RangeMax
Resident tabOpenClass;

Left Join (tabTickets)
LOAD Distinct
    RangeMin, RangeMax,
    Dual(RangeMin&'-'&RangeMax, RangeMin) as [Days Open Class]
Resident tabTickets;

DROP Table tabOpenClass;
DROP Field RangeMin, RangeMax;
hope this helps
regards
Marco
- Mark as New
- Bookmark
- Subscribe
- Mute
- Subscribe to RSS Feed
- Permalink
- Report Inappropriate Content
You can start with creating a chart with dimension field [Day Open], then use as expression
=Count([Ticket #])
and enable relative checkbox on expression tab, or alternatively use as expression
=Num( Count([Ticket #]) / Count(TOTAL [Ticket #]) , '#.00%','.',',')
- Mark as New
- Bookmark
- Subscribe
- Mute
- Subscribe to RSS Feed
- Permalink
- Report Inappropriate Content
Hi John,
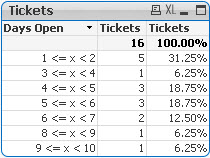
If the intervals are fixed you can use class() as per attachment.
Regards,
Chris
- Mark as New
- Bookmark
- Subscribe
- Mute
- Subscribe to RSS Feed
- Permalink
- Report Inappropriate Content
HI,
You can also try like this
Chart : Straight Table
Dimension: [Days Open]
Expression: Count([Ticket #])
and select Relative option in Expressions tab.
Regards,
Jagan.
- Mark as New
- Bookmark
- Subscribe
- Mute
- Subscribe to RSS Feed
- Permalink
- Report Inappropriate Content
Thank you this got me closer to what I am trying to accomplish.
jt
- Mark as New
- Bookmark
- Subscribe
- Mute
- Subscribe to RSS Feed
- Permalink
- Report Inappropriate Content
If you got the Answer close this thread by giving Correct and Helpful Answers to the posts which helps you in getting the answer.
Regards,
Jagan.
- Mark as New
- Bookmark
- Subscribe
- Mute
- Subscribe to RSS Feed
- Permalink
- Report Inappropriate Content
Hi,
for unequal sized buckets another solution could be:
tabTickets:
LOAD 10000+RecNo() as [Ticket #],
    Ceil(NORMINV((Rand()+1)/2,0,15)) as [Days Open]
AutoGenerate 1000;

tabOpenClass:
LOAD RangeMin,
    Alt(Peek(RangeMin)-1, Dual('∞', 100000000000000)) as RangeMax
Inline [
RangeMin
50
30
20
15
10
5
1
];

Left Join (tabTickets)
IntervalMatch ([Days Open])
LOAD RangeMin, RangeMax
Resident tabOpenClass;

Left Join (tabTickets)
LOAD Distinct
    RangeMin, RangeMax,
    Dual(RangeMin&'-'&RangeMax, RangeMin) as [Days Open Class]
Resident tabTickets;

DROP Table tabOpenClass;
DROP Field RangeMin, RangeMax;
hope this helps
regards
Marco
- Mark as New
- Bookmark
- Subscribe
- Mute
- Subscribe to RSS Feed
- Permalink
- Report Inappropriate Content
MarcoWedel just out of curiosity, did you use NORMINV to get a random number which follow normal distribution? I have never used it and was curious what it means.
- Mark as New
- Bookmark
- Subscribe
- Mute
- Subscribe to RSS Feed
- Permalink
- Report Inappropriate Content
Hi sunindia,
you're right it's just been to get some nice sample data other than equal distributed (normal distributed instead, yes).
It's been mentioned by Henric here for example: https://community.qlik.com/blogs/qlikviewdesignblog/2013/08/26/monte-carlo-methods#comment-8831
regards
Marco
- Mark as New
- Bookmark
- Subscribe
- Mute
- Subscribe to RSS Feed
- Permalink
- Report Inappropriate Content
Awesome, thanks Marco. I always hated that whenever I create a random distribution it was equally distributed. Being able to generate normal distribution would be great. Do you know if there are other distributions that we can create?
- « Previous Replies
-
- 1
- 2
- Next Replies »