Unlock a world of possibilities! Login now and discover the exclusive benefits awaiting you.
- Qlik Community
- :
- All Forums
- :
- QlikView App Dev
- :
- Re: Headers over Column Names
- Subscribe to RSS Feed
- Mark Topic as New
- Mark Topic as Read
- Float this Topic for Current User
- Bookmark
- Subscribe
- Mute
- Printer Friendly Page
- Mark as New
- Bookmark
- Subscribe
- Mute
- Subscribe to RSS Feed
- Permalink
- Report Inappropriate Content
Headers over Column Names
Hi,
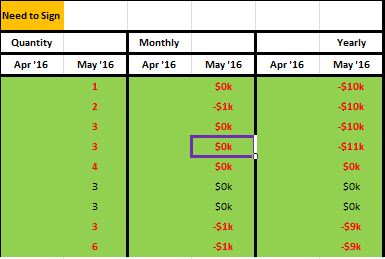
I have to create a table where I am using expressions to generate the columns "Apr '16", "May '16".....
How do I create headers on top of these columns as shown below?
I need to create Headers "Quantity", "Monthly" and "Yearly" on top of the month names.
Note: These header values do not exist anywhere, so I can't use them as Dimension and pull on top of the Month Columns.
- « Previous Replies
-
- 1
- 2
- Next Replies »
- Mark as New
- Bookmark
- Subscribe
- Mute
- Subscribe to RSS Feed
- Permalink
- Report Inappropriate Content
Hi Sunny,
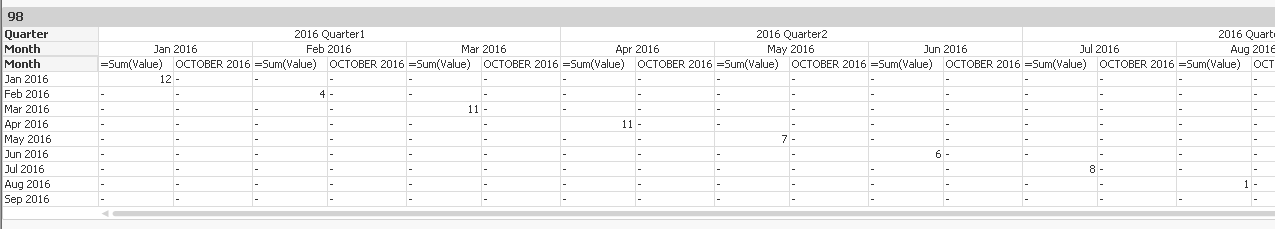
I just created another expression called OCTOBER 2016. You will find that the expression is being evaluated over every month. This expression is just an example. If this is the case, if I add other dimensions and expressions that I need to include in the chart, it will sabotage whole chart
- Mark as New
- Bookmark
- Subscribe
- Mute
- Subscribe to RSS Feed
- Permalink
- Report Inappropriate Content
What is the sabotage?
Just had to move some stuff around, but isn't this what you want?
- Mark as New
- Bookmark
- Subscribe
- Mute
- Subscribe to RSS Feed
- Permalink
- Report Inappropriate Content
Do you see the OCTOBER 2016 expression being evaluated for every month? Why do we need that? If that is happening to this expression, if I add more expressions further, they all will be evaluated for every month (in this case 12 times for 12 months).
- Mark as New
- Bookmark
- Subscribe
- Mute
- Subscribe to RSS Feed
- Permalink
- Report Inappropriate Content
Yes, that seems to be an issue. I haven't able to resolve this. May be someone else can 
- Mark as New
- Bookmark
- Subscribe
- Mute
- Subscribe to RSS Feed
- Permalink
- Report Inappropriate Content
Yeah, but your solution does work like a charm if I am dealing only with two entities, Month and the values corresponding to those months. Unfortunately, I need to add many more dimensions and expressions.
- Mark as New
- Bookmark
- Subscribe
- Mute
- Subscribe to RSS Feed
- Permalink
- Report Inappropriate Content
See if this helps:
Script:
Load * Inline
[
Month,Value
Jan 2016,2
Jan 2016,4
Jan 2016,6
Feb 2016,1
Feb 2016,3
Mar 2016,5
Mar 2016,6
Apr 2016,10
Apr 2016,1
May 2016,4
May 2016,3
Jun 2016,1
Jun 2016,5
Jul 2016,2
Jul 2016,6
Aug 2016,1
Sep 2016,7
Oct 2016,1
Oct 2016,4
Oct 2016,7
Nov 2016,9
Dec 2016,10
];
Dim:
LOAD * Inline [
ExpHeader
1
2
];
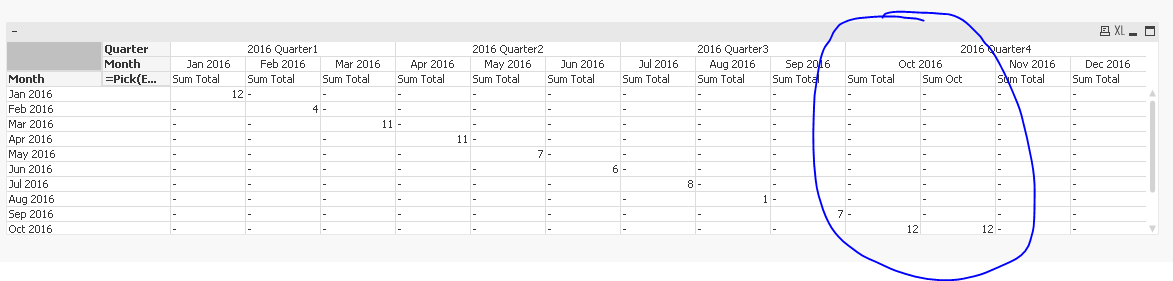
Dimensions
1) Month
2) =Year(Date#(Month, 'MMM YYYY')) & ' Quarter' & Ceil(Month(Date#(Month, 'MMM YYYY'))/3)
3) Month
4) =Pick(ExpHeader, 'Sum Total', 'Sum Oct')
Expression
=Pick(ExpHeader, Sum(Value), if(Month='Oct 2016', sum(Value)))
As long as you have just one expression, everything can work for you.
- Mark as New
- Bookmark
- Subscribe
- Mute
- Subscribe to RSS Feed
- Permalink
- Report Inappropriate Content
Thanks Sunny. We can do this for one expression. But we can't keep adjusting for other dimensions and expressions if they are too many. I will think about what you have provided.
- Mark as New
- Bookmark
- Subscribe
- Mute
- Subscribe to RSS Feed
- Permalink
- Report Inappropriate Content
You can do this for 100 expression in a go with a very long pick statement
- « Previous Replies
-
- 1
- 2
- Next Replies »