Unlock a world of possibilities! Login now and discover the exclusive benefits awaiting you.
- Qlik Community
- :
- All Forums
- :
- QlikView App Dev
- :
- Re: Hello, How can I group amount spent by custome...
- Subscribe to RSS Feed
- Mark Topic as New
- Mark Topic as Read
- Float this Topic for Current User
- Bookmark
- Subscribe
- Mute
- Printer Friendly Page
- Mark as New
- Bookmark
- Subscribe
- Mute
- Subscribe to RSS Feed
- Permalink
- Report Inappropriate Content
Hello, How can I group amount spent by customers into different sized bands?
Hello, How can I group amount spent by customers into different sized bands?
- Tags:
- new_to_qlikview
Accepted Solutions
- Mark as New
- Bookmark
- Subscribe
- Mute
- Subscribe to RSS Feed
- Permalink
- Report Inappropriate Content
Hi
First create Bucket in the Script. Like this:
If(Amount<=0,'<=0',
If(Amount>0 AND Amount<=1000,'0-1000',
If(Amount>1000 AND Amount<=3000,'1000-3000',
If(Amount>3000,'3000 plus')))) AS Buckets
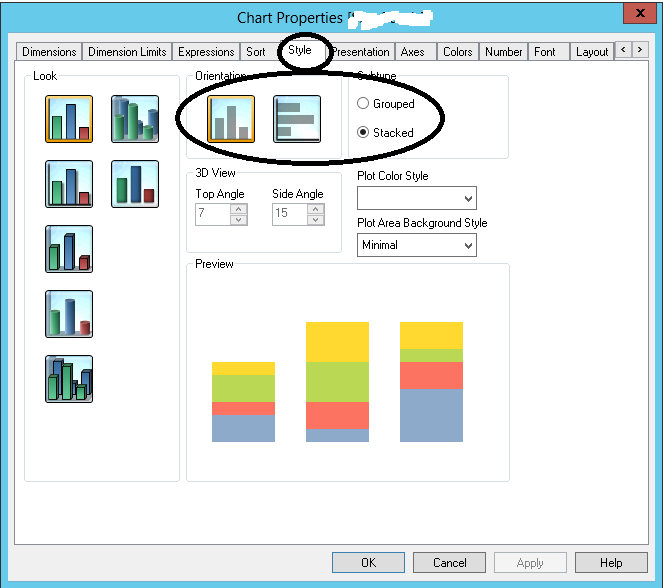
After Reload, Create Stacked Bar Chart:
a) Dimension: Month
b) Expression: (Create 4 Expressions)
1) Count(DISTINCT{<Buckets={'<=0'}>}Customers) // For <=0 Bucket
2) Count(DISTINCT{<Buckets={'0-1000'}>}Customers) // For 0-1000 Bucket
3) Count(DISTINCT{<Buckets={'1000-3000'}>}Customers) // For 1000-3000 Bucket
4) Count(DISTINCT{<Buckets={'3000 plus'}>}Customers) // For 3000 plus Bucket
For Stacked Bar Chart Setting see the Snapshot:
Regards
Av7en
- Mark as New
- Bookmark
- Subscribe
- Mute
- Subscribe to RSS Feed
- Permalink
- Report Inappropriate Content
Sorry - to be clearer, I have a list of customers and how much they paid in a transaction and would like to group them.
0
0-1000
1000-3000
3000 plus
Thank you - its day one using qlikview
- Mark as New
- Bookmark
- Subscribe
- Mute
- Subscribe to RSS Feed
- Permalink
- Report Inappropriate Content
hi
try class() function.
or try this
if(customers='A','0-1000') as field; like this
- Mark as New
- Bookmark
- Subscribe
- Mute
- Subscribe to RSS Feed
- Permalink
- Report Inappropriate Content
Hi,
Use can Class function to achieve this
for example....
=Class([Paid amount],1000)
Thanks and Regards,
Vivek
- Mark as New
- Bookmark
- Subscribe
- Mute
- Subscribe to RSS Feed
- Permalink
- Report Inappropriate Content
Hi
Dimension: Customers
Expression:
If(Sum(Amount)<=0,'0',
If(Sum(Amount)>0 AND Sum(Amount)<=1000,'0-1000',
If(Sum(Amount)>1000 AND Sum(Amount)<=3000,'1000-3000',
If(Sum(Amount)>3000,'3000 plus','Not Defined'))))
or, you can create buckets in the Script
Load
Customers,
If(Sum(Amount)<=0,'0',
If(Sum(Amount)>0 AND Sum(Amount)<=1000,'0-1000',
If(Sum(Amount)>1000 AND Sum(Amount)<=3000,'1000-3000',
If(Sum(Amount)>3000,'3000 plus','Not Defined')))) AS Buckets
From FileName
Group By Customers;
Regards
Aviral Nag
- Mark as New
- Bookmark
- Subscribe
- Mute
- Subscribe to RSS Feed
- Permalink
- Report Inappropriate Content
Aveeeeee7en, thank I will try this. If the file name is a like to an SQL server what would I need to write in the script? Thank you again
- Mark as New
- Bookmark
- Subscribe
- Mute
- Subscribe to RSS Feed
- Permalink
- Report Inappropriate Content
Sorry - What I am trying to do is a stacked bar chart which shows across the bottom - month of purchase. The stacked is a count of the customers banded by the amount of the transaction.
0
0-1000
1000-3000
3000 plus.
Can I do this?
- Mark as New
- Bookmark
- Subscribe
- Mute
- Subscribe to RSS Feed
- Permalink
- Report Inappropriate Content
Hi Paul,
For the grouping according to different brands see below script for the example
test:
LOAD * INLINE [
Customers, Brand,Price
Cars1 , a , 100
Cars2 , b ,300
Cars1 ,a ,200
Cars2 ,b ,400
Cars5 , c ,500
];
NoConcatenate
Abc:
load Customers, Brand, sum(Price) as SpentAmount
Resident test
group by Customers, Brand;
DROP Table test;
- Mark as New
- Bookmark
- Subscribe
- Mute
- Subscribe to RSS Feed
- Permalink
- Report Inappropriate Content
I need to draw a chart which shows by month, the number of customer that spent between,
0
0-1000
1000-3000
3000 plus.
However I dont have the banded groups, just the amount the spent. For example I want someone that spent 1005 to be banded in the 1000-3000 band and then display a stacked bar from counting the number of customers in each. PLEASE HELP
- Mark as New
- Bookmark
- Subscribe
- Mute
- Subscribe to RSS Feed
- Permalink
- Report Inappropriate Content
Hi
First create Bucket in the Script. Like this:
If(Amount<=0,'<=0',
If(Amount>0 AND Amount<=1000,'0-1000',
If(Amount>1000 AND Amount<=3000,'1000-3000',
If(Amount>3000,'3000 plus')))) AS Buckets
After Reload, Create Stacked Bar Chart:
a) Dimension: Month
b) Expression: (Create 4 Expressions)
1) Count(DISTINCT{<Buckets={'<=0'}>}Customers) // For <=0 Bucket
2) Count(DISTINCT{<Buckets={'0-1000'}>}Customers) // For 0-1000 Bucket
3) Count(DISTINCT{<Buckets={'1000-3000'}>}Customers) // For 1000-3000 Bucket
4) Count(DISTINCT{<Buckets={'3000 plus'}>}Customers) // For 3000 plus Bucket
For Stacked Bar Chart Setting see the Snapshot:
Regards
Av7en