Unlock a world of possibilities! Login now and discover the exclusive benefits awaiting you.
- Qlik Community
- :
- All Forums
- :
- QlikView App Dev
- :
- Re: Re: Help - Need to pick last operation per dep...
- Subscribe to RSS Feed
- Mark Topic as New
- Mark Topic as Read
- Float this Topic for Current User
- Bookmark
- Subscribe
- Mute
- Printer Friendly Page
- Mark as New
- Bookmark
- Subscribe
- Mute
- Subscribe to RSS Feed
- Permalink
- Report Inappropriate Content
Help - Need to pick last operation per department to calculate output
Hi,
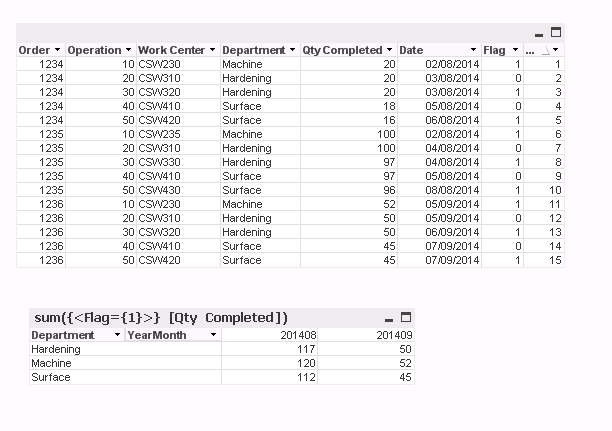
Need to cacluated Qty Completed for the last operation for the department to calculate output per department.
Below is a simple example for one production order. In this case I need some help to 1) flag the last operation in script and then sum it in pivot, or 2) calculate this in expression. I am thinking that firstorted value can be used?
Hope someone can offer their advise.
| Operation | Work Center | Department | Qty Completed | Date | |||||||||||||||||||||||||||||||||||||||||||||||||||||||||||||||||||
| 10 | CSW230 | Machine | 20 | 02.08.2014 | |||||||||||||||||||||||||||||||||||||||||||||||||||||||||||||||||||
| 20 | CSW310 | Hardening | 20 | 03.08.2014 | |||||||||||||||||||||||||||||||||||||||||||||||||||||||||||||||||||
| 30 | CSW320 | Hardening | 20 | 03.08.2014 | |||||||||||||||||||||||||||||||||||||||||||||||||||||||||||||||||||
| 40 | CSW410 | Surface | 18 | 05.08.2014 | |||||||||||||||||||||||||||||||||||||||||||||||||||||||||||||||||||
| 50 | CSW420 | Surface | 16 | 06.08.2014 | |||||||||||||||||||||||||||||||||||||||||||||||||||||||||||||||||||
Intended result: | |||||||||||||||||||||||||||||||||||||||||||||||||||||||||||||||||||||||
| |||||||||||||||||||||||||||||||||||||||||||||||||||||||||||||||||||||||
- « Previous Replies
-
- 1
- 2
- Next Replies »
Accepted Solutions
- Mark as New
- Bookmark
- Subscribe
- Mute
- Subscribe to RSS Feed
- Permalink
- Report Inappropriate Content
- Mark as New
- Bookmark
- Subscribe
- Mute
- Subscribe to RSS Feed
- Permalink
- Report Inappropriate Content
Create a Straight Table
Dimension
Department
Expression
FirstSortedValue(Distinct [Qty Completed],-Date)
- Mark as New
- Bookmark
- Subscribe
- Mute
- Subscribe to RSS Feed
- Permalink
- Report Inappropriate Content
Hi,
Very helpful. I forgot to mention the order number and that we have several orders in the same format that I need to sum and aggregate qty delivered per department over a period of time. How should I make this aggregation?
- Mark as New
- Bookmark
- Subscribe
- Mute
- Subscribe to RSS Feed
- Permalink
- Report Inappropriate Content
If you provide proper data (dummy Data), would like to try for you...
- Mark as New
- Bookmark
- Subscribe
- Mute
- Subscribe to RSS Feed
- Permalink
- Report Inappropriate Content
Thanks! Attached an example of dummy data for this purpose.
Regards,
Freddy
- Mark as New
- Bookmark
- Subscribe
- Mute
- Subscribe to RSS Feed
- Permalink
- Report Inappropriate Content
Can you explain your requirements with possible output you want ?
- Mark as New
- Bookmark
- Subscribe
- Mute
- Subscribe to RSS Feed
- Permalink
- Report Inappropriate Content
Yes.
Sum of Qty completed (on the last operation per department) per department per month.
This should represent the output of the department. Since we have several work centers and operations within one department we can not simply sum all work centers output.
Clear enough or do you want me to make a excel sheet showing this?
Freddy
- Mark as New
- Bookmark
- Subscribe
- Mute
- Subscribe to RSS Feed
- Permalink
- Report Inappropriate Content
Excel sheet would be more helpful...
- Mark as New
- Bookmark
- Subscribe
- Mute
- Subscribe to RSS Feed
- Permalink
- Report Inappropriate Content
Ok. Attachced.
Freddy
- Mark as New
- Bookmark
- Subscribe
- Mute
- Subscribe to RSS Feed
- Permalink
- Report Inappropriate Content
Hi. Anybody that could help me on this?
Best regards,
Freddy
- « Previous Replies
-
- 1
- 2
- Next Replies »