Unlock a world of possibilities! Login now and discover the exclusive benefits awaiting you.
- Qlik Community
- :
- All Forums
- :
- QlikView App Dev
- :
- Help in bar chart
- Subscribe to RSS Feed
- Mark Topic as New
- Mark Topic as Read
- Float this Topic for Current User
- Bookmark
- Subscribe
- Mute
- Printer Friendly Page
- Mark as New
- Bookmark
- Subscribe
- Mute
- Subscribe to RSS Feed
- Permalink
- Report Inappropriate Content
Help in bar chart
Hi Team,
I am new to qlikview. I have a requirement where i have 4 columns as below
| Created to Approved | Approved To Master-Staging | Master-Staging to Master | Total Time |
| 0.04 | 3.82 | 0.75 | 4.60 |
| 14.07 | 0.00 | 4.09 | 18.17 |
| 1.77 | 0.51 | 4.29 | 6.58 |
| 6.96 | 0.00 | 4.56 | 11.52 |
| 0.25 | 0.00 | 4.58 | 4.82 |
| 2.13 | 0.00 | 4.62 | 6.75 |
| 0.79 | 0.00 | 4.63 | 5.42 |
| 9.61 | 0.07 | 4.64 | 14.32 |
| 10.78 | 0.00 | 4.69 | 15.47 |
| 0.70 | 0.21 | 5.04 | 5.95 |
| 14.68 | 1.43 | 5.23 | 21.34 |
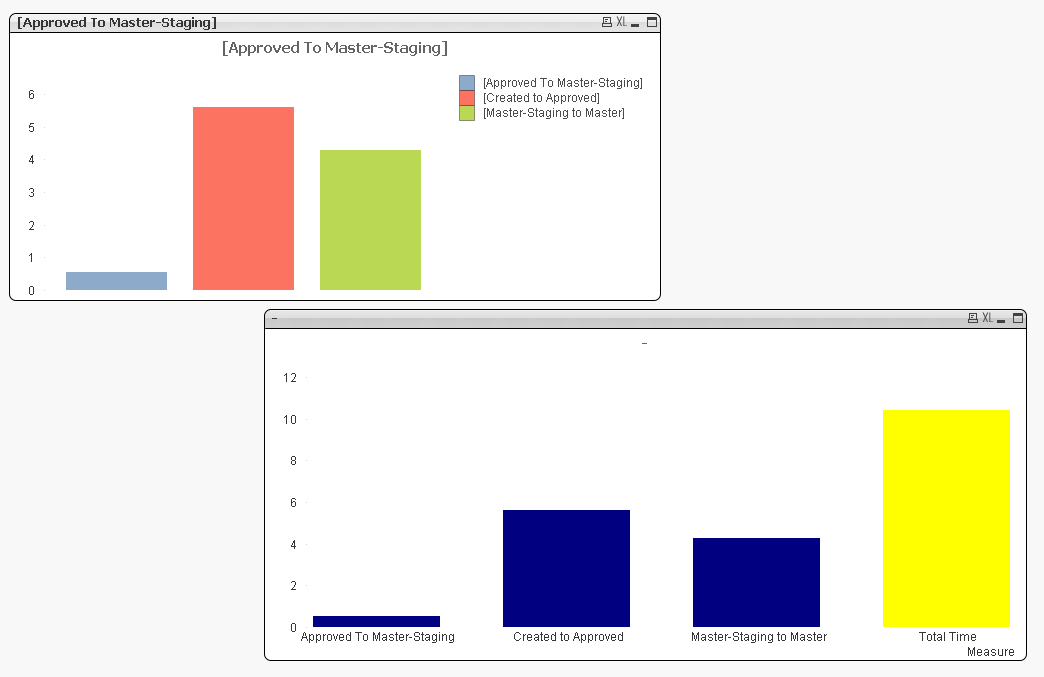
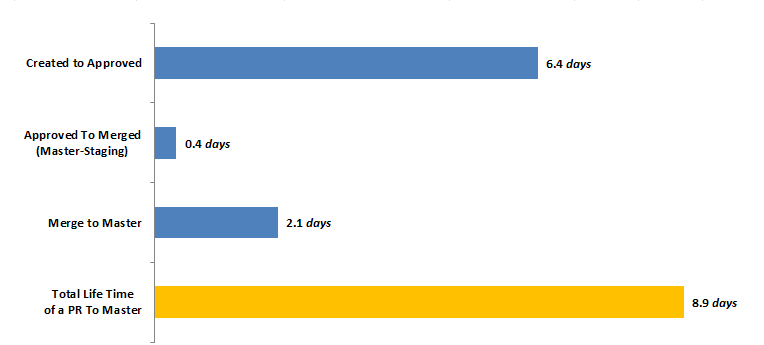
I need to produce the graph as below:
Can you please help me here:
these are the AVERAGE of the individual columns
Accepted Solutions
- Mark as New
- Bookmark
- Subscribe
- Mute
- Subscribe to RSS Feed
- Permalink
- Report Inappropriate Content
I wouldn't use anything, I don't think you will need one?
If you do then use valuelist, will try it out in a sec
- Mark as New
- Bookmark
- Subscribe
- Mute
- Subscribe to RSS Feed
- Permalink
- Report Inappropriate Content
just use the formula avg(columnname) as your expression for each column
- Mark as New
- Bookmark
- Subscribe
- Mute
- Subscribe to RSS Feed
- Permalink
- Report Inappropriate Content
Thanks Adam.
What should I use in Dimension?
- Mark as New
- Bookmark
- Subscribe
- Mute
- Subscribe to RSS Feed
- Permalink
- Report Inappropriate Content
I wouldn't use anything, I don't think you will need one?
If you do then use valuelist, will try it out in a sec
- Mark as New
- Bookmark
- Subscribe
- Mute
- Subscribe to RSS Feed
- Permalink
- Report Inappropriate Content
You can leave it empty.
- Mark as New
- Bookmark
- Subscribe
- Mute
- Subscribe to RSS Feed
- Permalink
- Report Inappropriate Content
Valuelist means you can get some nice simple labels which I prefer, bit more of a fiddly setup so depends what you want really!