Unlock a world of possibilities! Login now and discover the exclusive benefits awaiting you.
Announcements
April 13–15 - Dare to Unleash a New Professional You at Qlik Connect 2026: Register Now!
- Qlik Community
- :
- All Forums
- :
- QlikView App Dev
- :
- Help with Chart
Options
- Subscribe to RSS Feed
- Mark Topic as New
- Mark Topic as Read
- Float this Topic for Current User
- Bookmark
- Subscribe
- Mute
- Printer Friendly Page
Turn on suggestions
Auto-suggest helps you quickly narrow down your search results by suggesting possible matches as you type.
Showing results for
Anonymous
Not applicable
2016-01-26
11:26 AM
- Mark as New
- Bookmark
- Subscribe
- Mute
- Subscribe to RSS Feed
- Permalink
- Report Inappropriate Content
Help with Chart
Hi All
I am tasked with creating a Bar chart with age range
so Dimensions are days 0-20, 21-40, 41-60 etc
And it counts how many tickets are open
My question is how do i go about this?
676 Views
1 Solution
Accepted Solutions
MVP
2016-01-26
11:39 AM
- Mark as New
- Bookmark
- Subscribe
- Mute
- Subscribe to RSS Feed
- Permalink
- Report Inappropriate Content
591 Views
5 Replies
MVP
2016-01-26
11:28 AM
- Mark as New
- Bookmark
- Subscribe
- Mute
- Subscribe to RSS Feed
- Permalink
- Report Inappropriate Content
Use a calculated Dimension using Class function and a simple Count function for counting field in each bucket. Would you be able to to share a small sample to help you better?
Creator
2016-01-26
11:31 AM
- Mark as New
- Bookmark
- Subscribe
- Mute
- Subscribe to RSS Feed
- Permalink
- Report Inappropriate Content
591 Views
Champion III
2016-01-26
11:32 AM
- Mark as New
- Bookmark
- Subscribe
- Mute
- Subscribe to RSS Feed
- Permalink
- Report Inappropriate Content
Have a look at
You can probably use something like
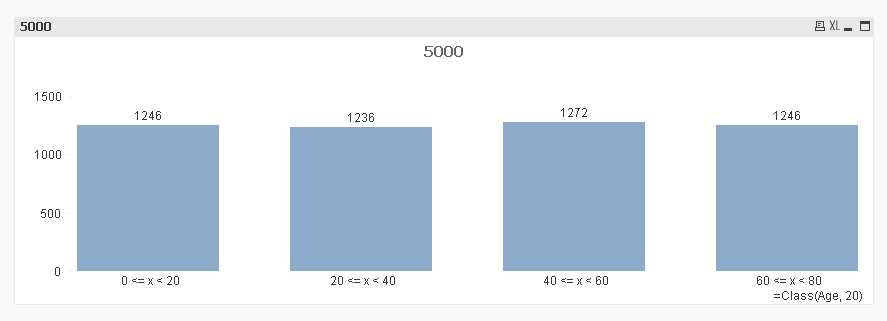
=Class( AgeField, 20)
as calculated dimension and
=Count( AgeField)
as expression.
MVP
2016-01-26
11:39 AM
- Mark as New
- Bookmark
- Subscribe
- Mute
- Subscribe to RSS Feed
- Permalink
- Report Inappropriate Content
See if the attach helps
592 Views
Anonymous
Not applicable
2016-01-26
12:17 PM
Author
- Mark as New
- Bookmark
- Subscribe
- Mute
- Subscribe to RSS Feed
- Permalink
- Report Inappropriate Content
Sunny Thanks for your help!
Any ideas how to change the Labels on the bottom?
so it says 0-20, 21-40 etc?
Currently saus 0>x=20... etc
591 Views