Unlock a world of possibilities! Login now and discover the exclusive benefits awaiting you.
- Qlik Community
- :
- All Forums
- :
- QlikView App Dev
- :
- Help with Historical average
- Subscribe to RSS Feed
- Mark Topic as New
- Mark Topic as Read
- Float this Topic for Current User
- Bookmark
- Subscribe
- Mute
- Printer Friendly Page
- Mark as New
- Bookmark
- Subscribe
- Mute
- Subscribe to RSS Feed
- Permalink
- Report Inappropriate Content
Help with Historical average
This is a bit of a newbie question I think.
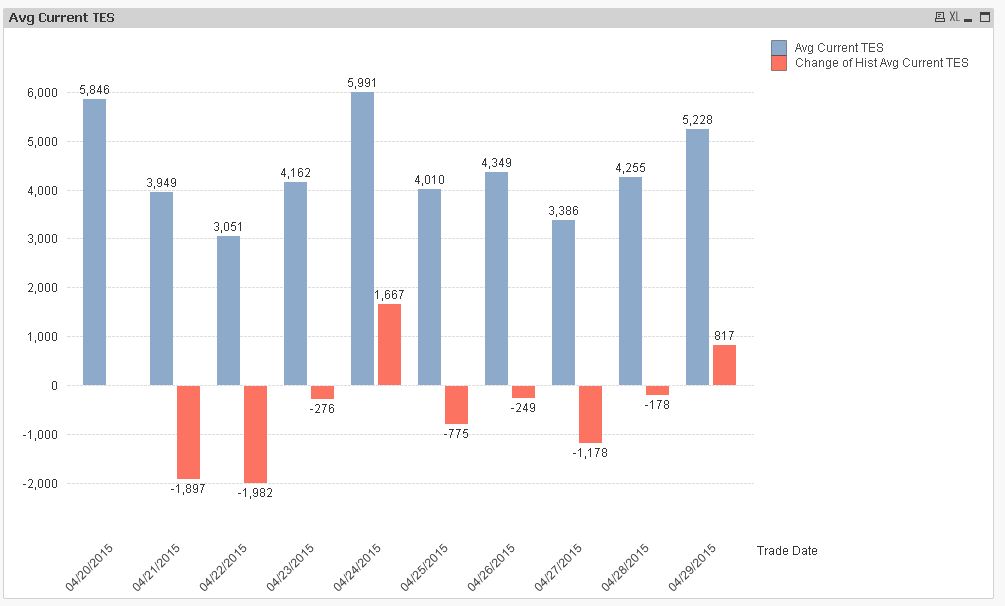
I am trying to figure out how to calculate the change in the historical average for a value, and display in a chart or table.
Here is an example.
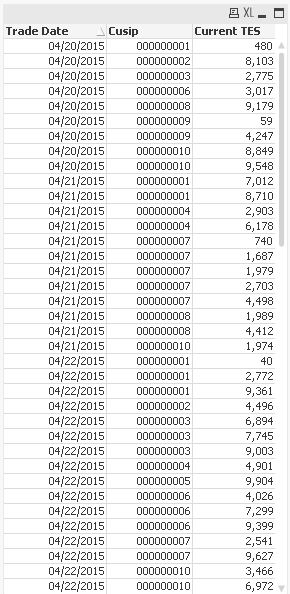
| Trade Date | Cusip | Current TES |
| 3/2/2015 | 00037CRG7 | 154.6654 |
| 3/2/2015 | 00037CRG7 | 156.0904 |
| 3/2/2015 | 00037CRG7 | 170.3641 |
| 3/3/2015 | 00037CRG7 | 150.2771 |
| 3/11/2015 | 00037CRG7 | 161.8665 |
The historical average is the average(Current TES) of all records other than the ones on the most recent date. The change in the historical average is the difference between the average of all records prior to most recent date and the average of the records on the most recent date.
Thanks!
- Mark as New
- Bookmark
- Subscribe
- Mute
- Subscribe to RSS Feed
- Permalink
- Report Inappropriate Content
Hi,
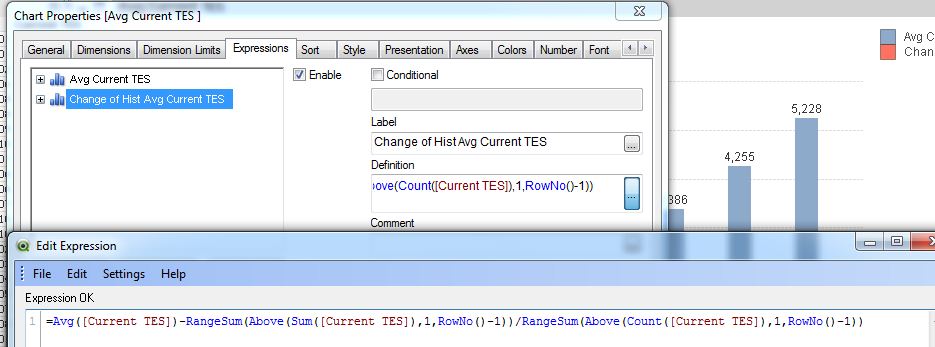
one solution could be:
=Avg([Current TES])-RangeSum(Above(Sum([Current TES]),1,RowNo()-1))/RangeSum(Above(Count([Current TES]),1,RowNo()-1))
hope this helps
regards
Marco