Unlock a world of possibilities! Login now and discover the exclusive benefits awaiting you.
- Qlik Community
- :
- All Forums
- :
- QlikView App Dev
- :
- Re: Help with Pivot Chart Expression
- Subscribe to RSS Feed
- Mark Topic as New
- Mark Topic as Read
- Float this Topic for Current User
- Bookmark
- Subscribe
- Mute
- Printer Friendly Page
- Mark as New
- Bookmark
- Subscribe
- Mute
- Subscribe to RSS Feed
- Permalink
- Report Inappropriate Content
Help with Pivot Chart Expression
HI
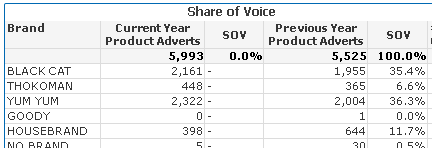
I am trying to create a Pivot Chart and calculate the contribution (relative to column) however I can't get it right.
My Chart looks like:

and my expression for Current Year is =count({<range={'CURRENT YEAR'}>}dl_descr)
How can I create the SOV in a pivot, can only get it to work in straight table
- Mark as New
- Bookmark
- Subscribe
- Mute
- Subscribe to RSS Feed
- Permalink
- Report Inappropriate Content
Not entirely sure what you are trying to do, would you be able to share a sample?
- Mark as New
- Bookmark
- Subscribe
- Mute
- Subscribe to RSS Feed
- Permalink
- Report Inappropriate Content
What you have tried for SOV for prev year??
- Mark as New
- Bookmark
- Subscribe
- Mute
- Subscribe to RSS Feed
- Permalink
- Report Inappropriate Content
This is what I am trying to create:

The table is a straight table that I was attempting to get the expression correct so that I could pivot the chart, so prev SOV is the same expression as Current/Previous Prod adv but with relative 
What I need to do is to calculate the contribution percentage of each row to total of column
- Mark as New
- Bookmark
- Subscribe
- Mute
- Subscribe to RSS Feed
- Permalink
- Report Inappropriate Content
Would you provide expression
OR
Sum(TOTAL <YourExpression> Sales)