Unlock a world of possibilities! Login now and discover the exclusive benefits awaiting you.
- Qlik Community
- :
- All Forums
- :
- QlikView App Dev
- :
- Re: Help with expression in chart, and suppressed ...
- Subscribe to RSS Feed
- Mark Topic as New
- Mark Topic as Read
- Float this Topic for Current User
- Bookmark
- Subscribe
- Mute
- Printer Friendly Page
- Mark as New
- Bookmark
- Subscribe
- Mute
- Subscribe to RSS Feed
- Permalink
- Report Inappropriate Content
Help with expression in chart, and suppressed values
Hello all,
As you have read, I have a small problem that I cannot solve on my own.
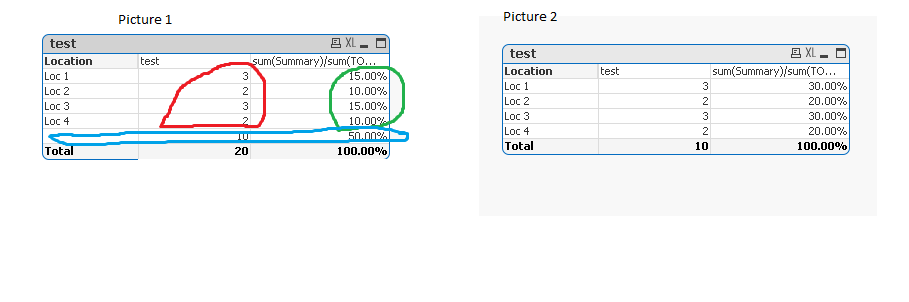
I need to sum all red values, so that I can get the percentage marked in green.
The blue values should be suppressed, and the final chart should look like picture 2.
I have tried with Len(trim(Location)>0, Location) as a calculated dimension, as well as adding same conditional to the expression.
Also I have attached the sample qvw with scrambled data, which is the application that I'm having trouble with.
Thanks in advance
Accepted Solutions
- Mark as New
- Bookmark
- Subscribe
- Mute
- Subscribe to RSS Feed
- Permalink
- Report Inappropriate Content
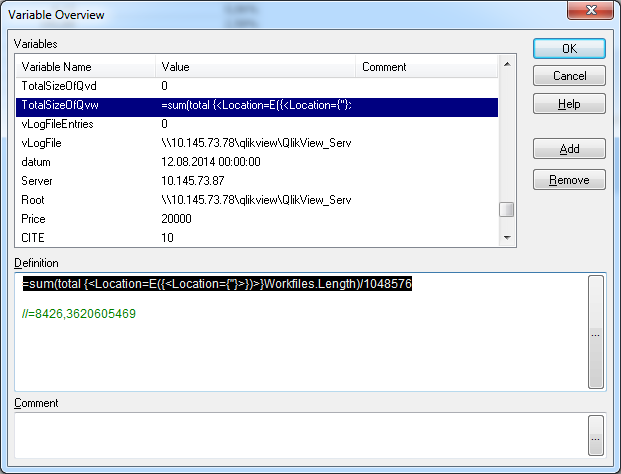
instead of a constant number assigned to the variable TotalSizeOfQvw, modify its definition to
=sum(total {<Location=E({<Location={''}>})>}Workfiles.Length)/1048576
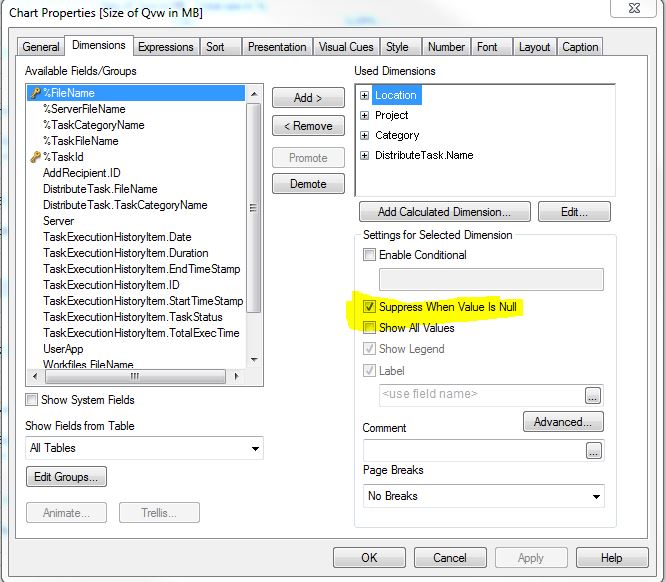
and make sure to check suppress when value is null for Location dimension.
- Mark as New
- Bookmark
- Subscribe
- Mute
- Subscribe to RSS Feed
- Permalink
- Report Inappropriate Content
instead of a constant number assigned to the variable TotalSizeOfQvw, modify its definition to
=sum(total {<Location=E({<Location={''}>})>}Workfiles.Length)/1048576
and make sure to check suppress when value is null for Location dimension.
- Mark as New
- Bookmark
- Subscribe
- Mute
- Subscribe to RSS Feed
- Permalink
- Report Inappropriate Content
Select "Suppress When Value is Null" option on the Chart Properties --> Dimensions
- Mark as New
- Bookmark
- Subscribe
- Mute
- Subscribe to RSS Feed
- Permalink
- Report Inappropriate Content
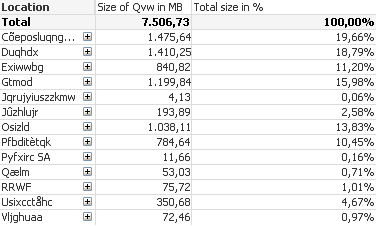
in addition to the two things in my previous post, you need to check show partial sums in presentation tab. then you will have the following:
- Mark as New
- Bookmark
- Subscribe
- Mute
- Subscribe to RSS Feed
- Permalink
- Report Inappropriate Content
Could you please send me qvw?
- Mark as New
- Bookmark
- Subscribe
- Mute
- Subscribe to RSS Feed
- Permalink
- Report Inappropriate Content
here you go!
- Mark as New
- Bookmark
- Subscribe
- Mute
- Subscribe to RSS Feed
- Permalink
- Report Inappropriate Content
sorry try this one...
ps: the variable seems to be getting recalculated at document open. use the following expression for Total size in %
sum(Workfiles.Length) / sum(total {<Location=E({<Location={''}>})>}Workfiles.Length)