Unlock a world of possibilities! Login now and discover the exclusive benefits awaiting you.
- Qlik Community
- :
- All Forums
- :
- QlikView App Dev
- :
- Re: Help with formula
- Subscribe to RSS Feed
- Mark Topic as New
- Mark Topic as Read
- Float this Topic for Current User
- Bookmark
- Subscribe
- Mute
- Printer Friendly Page
- Mark as New
- Bookmark
- Subscribe
- Mute
- Subscribe to RSS Feed
- Permalink
- Report Inappropriate Content
Help with formula
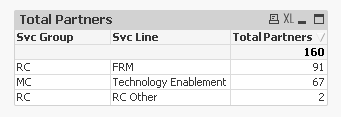
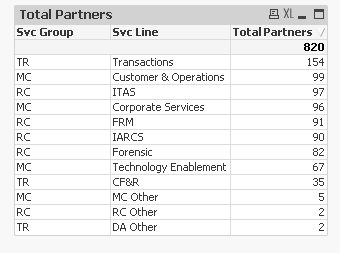
I'm trying to write a formula that will give me the following detail for each of the two columns Svc Group and Svc line.
I only want to pull in the following from Svc Group:
MC
RC
TR
And I only want to pull in the following from Svc Line:
Transaction
FRM
RC Other
Technology Enablement
Can anyone please help
Accepted Solutions
- Mark as New
- Bookmark
- Subscribe
- Mute
- Subscribe to RSS Feed
- Permalink
- Report Inappropriate Content
May be try this expression:
Count({<[Svc Group] = {'MC', 'RC', 'TR'}, [Svc Line] = {'Transaction', 'FRM', 'RC Other', 'Technology Enablement'}>}[Partner ID])
- Mark as New
- Bookmark
- Subscribe
- Mute
- Subscribe to RSS Feed
- Permalink
- Report Inappropriate Content
May be try this expression:
Count({<[Svc Group] = {'MC', 'RC', 'TR'}, [Svc Line] = {'Transaction', 'FRM', 'RC Other', 'Technology Enablement'}>}[Partner ID])
- Mark as New
- Bookmark
- Subscribe
- Mute
- Subscribe to RSS Feed
- Permalink
- Report Inappropriate Content
Or this, if this is not and condition, but an or condition (show this or show that)
Count({<[Svc Group] = {'MC', 'RC', 'TR'}>+<[Svc Line] = {'Transaction', 'FRM', 'RC Other', 'Technology Enablement'}>}[Partner ID])
- Mark as New
- Bookmark
- Subscribe
- Mute
- Subscribe to RSS Feed
- Permalink
- Report Inappropriate Content
load *,
........
from table
Where svcgroup='mc','rc','tr' and Svcline='
'Transaction',
'FRM',
'RC Other',
'Technology Enablement';
- Mark as New
- Bookmark
- Subscribe
- Mute
- Subscribe to RSS Feed
- Permalink
- Report Inappropriate Content
If I were to go this route I would do this in the edit script correct?
Would this limit svc group and svc line to only those that I've selected throughout the file. So any graphs or charts that I use it will only display svcgroup='mc','rc','tr' and Svcline='
'Transaction',
'FRM',
'RC Other',
'Technology Enablement';
- Mark as New
- Bookmark
- Subscribe
- Mute
- Subscribe to RSS Feed
- Permalink
- Report Inappropriate Content
sunindia I notice that after Count you have {< and at the end of your formula you have >}. Why do you have these in there?
- Mark as New
- Bookmark
- Subscribe
- Mute
- Subscribe to RSS Feed
- Permalink
- Report Inappropriate Content
This is a set analysis syntax. For more information on set analysis, it would be good to spend some time on the attached document