Unlock a world of possibilities! Login now and discover the exclusive benefits awaiting you.
Announcements
Qlik Open Lakehouse is Now Generally Available! Discover the key highlights and partner resources here.
- Qlik Community
- :
- All Forums
- :
- QlikView App Dev
- :
- Re: Hide Line in accumulated Line Chart
Options
- Subscribe to RSS Feed
- Mark Topic as New
- Mark Topic as Read
- Float this Topic for Current User
- Bookmark
- Subscribe
- Mute
- Printer Friendly Page
Turn on suggestions
Auto-suggest helps you quickly narrow down your search results by suggesting possible matches as you type.
Showing results for
Partner - Creator II
2018-11-01
06:25 AM
- Mark as New
- Bookmark
- Subscribe
- Mute
- Subscribe to RSS Feed
- Permalink
- Report Inappropriate Content
Hide Line in accumulated Line Chart
Hi There,
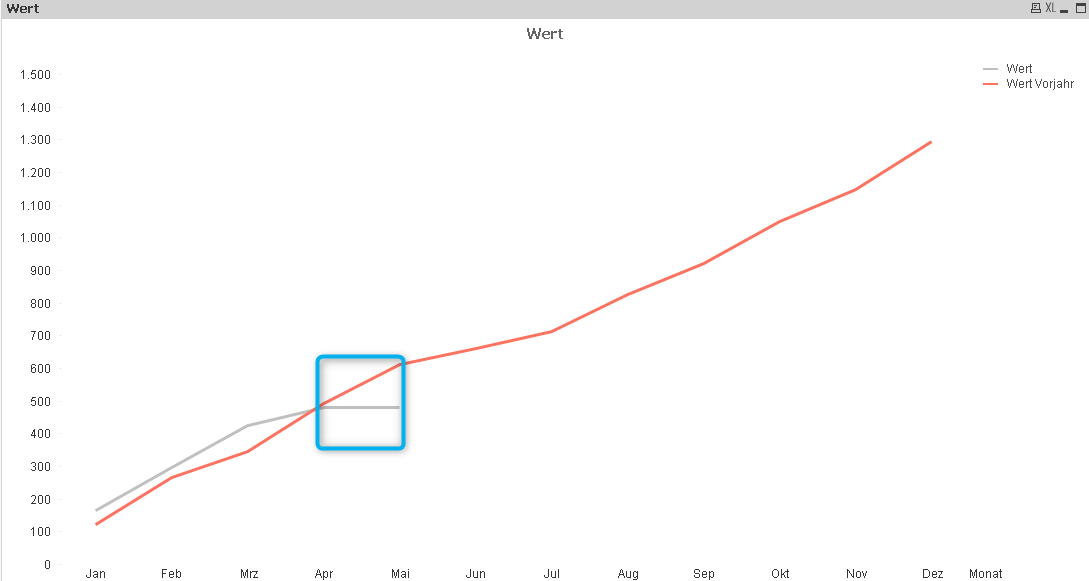
how can i hide a Line chart that is accumulated, when i select only some month?
I managed to hide most of it by setting the color transparency, but i can't get rid of the last part. If i change the color expression to smaller instead of smaller than, suddenly the whole line disapears.

I really would appriciate some help!
Thanks,
Fabian
782 Views
2 Replies
Master II
2018-11-01
06:39 AM
- Mark as New
- Bookmark
- Subscribe
- Mute
- Subscribe to RSS Feed
- Permalink
- Report Inappropriate Content
Hi Fabian, your attached qvw is empty. please reattach!
725 Views
MVP
2018-11-01
07:05 AM
- Mark as New
- Bookmark
- Subscribe
- Mute
- Subscribe to RSS Feed
- Permalink
- Report Inappropriate Content
Try this expression
RangeSum(Above(SUM(Wert), 0,RowNo())) * Avg(1)
with this background color
rgb(192,192,192)
726 Views