Unlock a world of possibilities! Login now and discover the exclusive benefits awaiting you.
- Qlik Community
- :
- All Forums
- :
- QlikView App Dev
- :
- Hide dimensions who are used in acc sum
- Subscribe to RSS Feed
- Mark Topic as New
- Mark Topic as Read
- Float this Topic for Current User
- Bookmark
- Subscribe
- Mute
- Printer Friendly Page
- Mark as New
- Bookmark
- Subscribe
- Mute
- Subscribe to RSS Feed
- Permalink
- Report Inappropriate Content
Hide dimensions who are used in acc sum
Hi there,
I used the folowing expression to accumulate a expression 12 yeamonth values back
=rangesum(above( sum({<CalenderYearMonth={"<=$(=max(Year)&right(0&max(Month),2))"}>}#SalesInvoiceQuantityInKilo),0,12) )
Is it possible to hide the first 12 dimension values.
The set analysis is used to select my calendar with is not connected becasue i have a fiscal and a normal calendar.
Who can help me with this question?
Regards,
Dirk
- Tags:
- qlikview_scripting
- « Previous Replies
-
- 1
- 2
- Next Replies »
- Mark as New
- Bookmark
- Subscribe
- Mute
- Subscribe to RSS Feed
- Permalink
- Report Inappropriate Content
This formula gives the same output as the previous 
- Mark as New
- Bookmark
- Subscribe
- Mute
- Subscribe to RSS Feed
- Permalink
- Report Inappropriate Content
Would you be able to share a sample?
- Mark as New
- Bookmark
- Subscribe
- Mute
- Subscribe to RSS Feed
- Permalink
- Report Inappropriate Content
Attaching a sample for you. May be this will explain what I am trying to do:
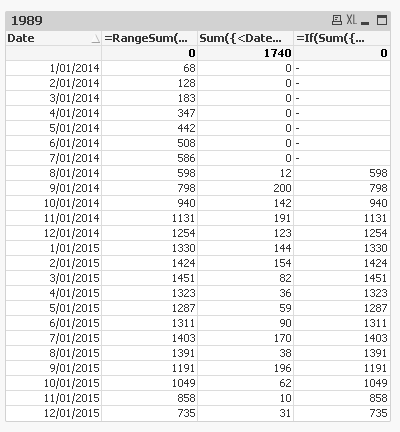
Expression 1: =RangeSum(Above(Sum({<Date = {"$(='<=' & Date(Today(), 'M/DD/YYYY'))"}>}Value), 0, 12))
This one is same as yours.
Expression 2: Sum({<Date = {"$(='>=' & Date(AddYears(Today(), -1), 'M/DD/YYYY'))"}>}Value)
Forced 0 for Months we don't want to see on the line chart
Expression 3:
=If(Sum({<Date = {"$(='>=' & Date(AddYears(Today(), -1), 'M/DD/YYYY'))"}>}Value) > 0,
RangeSum(Above(Sum({<Date = {"$(='<=' & Date(Today(), 'M/DD/YYYY'))"}>}Value), 0, 12)))
This is what you need.
Using the third expression in the line chart, I get this:
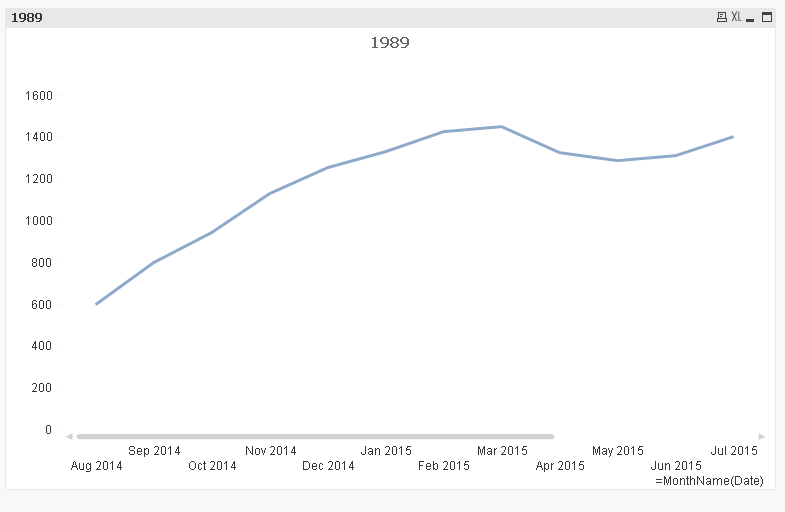
I hope this will help.
Best,
Sunny
- Mark as New
- Bookmark
- Subscribe
- Mute
- Subscribe to RSS Feed
- Permalink
- Report Inappropriate Content
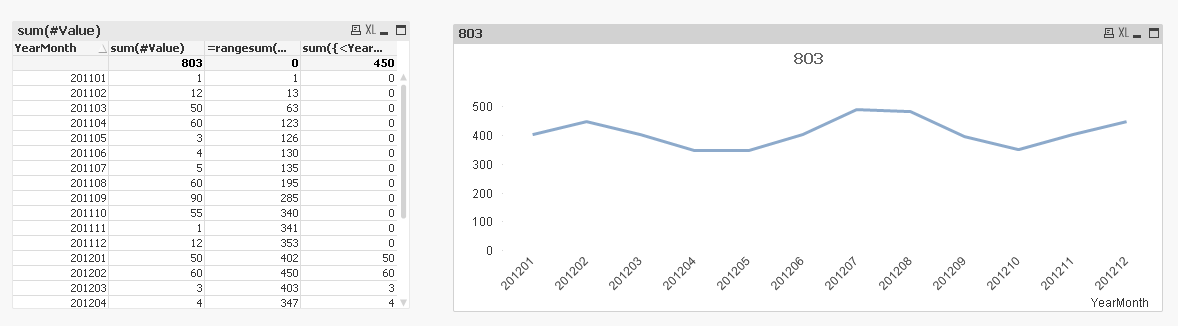
Here is a example and a picture what i want
- Mark as New
- Bookmark
- Subscribe
- Mute
- Subscribe to RSS Feed
- Permalink
- Report Inappropriate Content
Same idea as I used in my example, only issue is that your YearMonth is a text string and not date. I recommend converting YearMonth to a date field in the script, may be using MonthName() function. See if this helps:
- Mark as New
- Bookmark
- Subscribe
- Mute
- Subscribe to RSS Feed
- Permalink
- Report Inappropriate Content
See attached example.
talk is cheap, supply exceeds demand
- Mark as New
- Bookmark
- Subscribe
- Mute
- Subscribe to RSS Feed
- Permalink
- Report Inappropriate Content
What id we have more than 2 years of data ?
- « Previous Replies
-
- 1
- 2
- Next Replies »