Unlock a world of possibilities! Login now and discover the exclusive benefits awaiting you.
- Qlik Community
- :
- All Forums
- :
- QlikView App Dev
- :
- Hiding an expression in pivot table
- Subscribe to RSS Feed
- Mark Topic as New
- Mark Topic as Read
- Float this Topic for Current User
- Bookmark
- Subscribe
- Mute
- Printer Friendly Page
- Mark as New
- Bookmark
- Subscribe
- Mute
- Subscribe to RSS Feed
- Permalink
- Report Inappropriate Content
Hiding an expression in pivot table
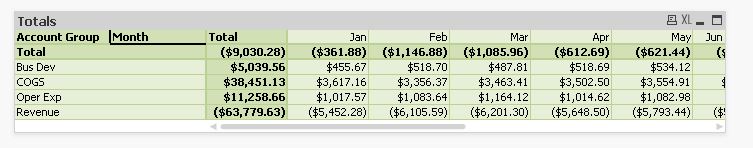
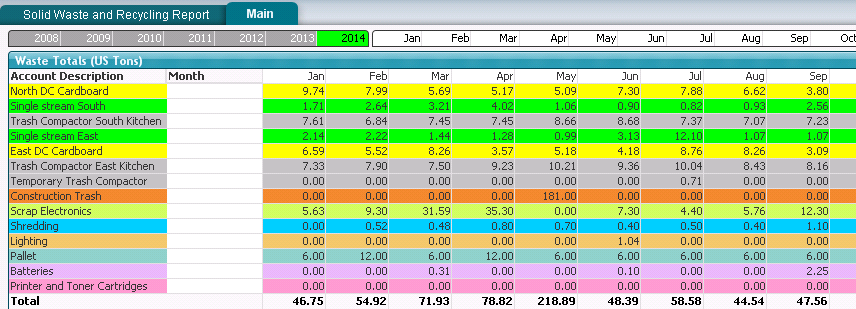
When hiding an expression 'Cost' in a pivot table using the conditional function of false(), it's removing the display of the other expression 'tons' (see result attachment) I'm not sure how to reformat the pivot table . The goal is to achieve the display in the first screen shot (before modification) but to remove or hide Cost column.
- « Previous Replies
-
- 1
- 2
- Next Replies »
- Mark as New
- Bookmark
- Subscribe
- Mute
- Subscribe to RSS Feed
- Permalink
- Report Inappropriate Content
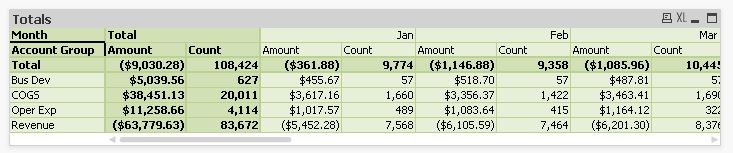 Before unchecking
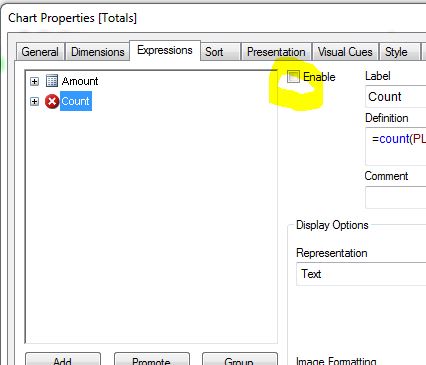
Unchecking
After unchecking
- Mark as New
- Bookmark
- Subscribe
- Mute
- Subscribe to RSS Feed
- Permalink
- Report Inappropriate Content
I assume that the Tricia's problem here that there is no label for the column "Amount" (?)
If there is only one expression, the column header is gone.
- Mark as New
- Bookmark
- Subscribe
- Mute
- Subscribe to RSS Feed
- Permalink
- Report Inappropriate Content
Yes I have a label for Tons. Puzzled why it was removed when unchecking Enable.
- Mark as New
- Bookmark
- Subscribe
- Mute
- Subscribe to RSS Feed
- Permalink
- Report Inappropriate Content
Attached is the qvw.
- Mark as New
- Bookmark
- Subscribe
- Mute
- Subscribe to RSS Feed
- Permalink
- Report Inappropriate Content
Sending back with two changes.
- Applied colors to the dummy expression
- Ran the macro (by pressing Test in macro editor)
- Mark as New
- Bookmark
- Subscribe
- Mute
- Subscribe to RSS Feed
- Permalink
- Report Inappropriate Content
One more idea - in my file, go to the chart properties, tab Style, and uncheck "Vertical Expression Cell Borders". Much cleaner look...
- Mark as New
- Bookmark
- Subscribe
- Mute
- Subscribe to RSS Feed
- Permalink
- Report Inappropriate Content
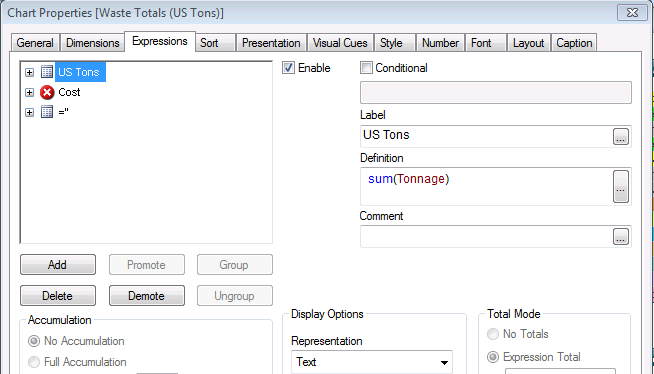
Hi Tricia,
Try this in you conditional expression. It achieves your desired result without unchecking the enable box.
if(sum(Tonnage)>=0,0,1)
- Mark as New
- Bookmark
- Subscribe
- Mute
- Subscribe to RSS Feed
- Permalink
- Report Inappropriate Content
I'm new to macros. Where did you invoke the macro?
- Mark as New
- Bookmark
- Subscribe
- Mute
- Subscribe to RSS Feed
- Permalink
- Report Inappropriate Content
Clicked "Test" button (on the left) in the macro editor.
- Mark as New
- Bookmark
- Subscribe
- Mute
- Subscribe to RSS Feed
- Permalink
- Report Inappropriate Content
Kamiel,
Thank you. However, This produces the same result as unchecking enable box. Michael's suggestion is working.
- « Previous Replies
-
- 1
- 2
- Next Replies »