Unlock a world of possibilities! Login now and discover the exclusive benefits awaiting you.
- Qlik Community
- :
- All Forums
- :
- QlikView App Dev
- :
- Highlighting Section of a Line Graph
- Subscribe to RSS Feed
- Mark Topic as New
- Mark Topic as Read
- Float this Topic for Current User
- Bookmark
- Subscribe
- Mute
- Printer Friendly Page
- Mark as New
- Bookmark
- Subscribe
- Mute
- Subscribe to RSS Feed
- Permalink
- Report Inappropriate Content
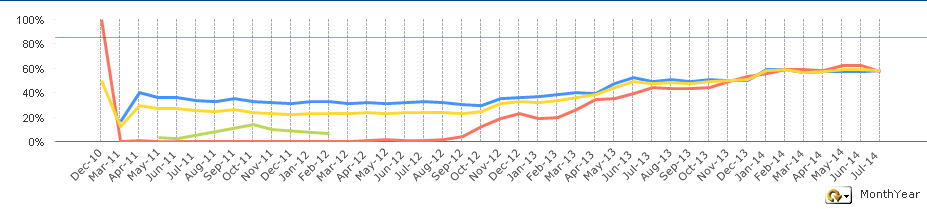
Highlighting Section of a Line Graph
Hi,
I have a line chart and I need to highlight anything that occurred from Dec 2013 onwards. Ideally, I would like to change the colour of the date labels along the x-axis. if this is not possible, can the background from Dec 2013 be altered etc?
Any help appreciated!
Tom
- Mark as New
- Bookmark
- Subscribe
- Mute
- Subscribe to RSS Feed
- Permalink
- Report Inappropriate Content
Tom -
See this post which will provide some insight.
Dynamically Changing the colour of the dimensio... | Qlik Community
However, here is a potential work-around:
Add your X-axis dimension as an expression too and only display 'Text on Axis'. Then you can apply your text color formatting to this dimension itself. You could then hide your dimension axis and only show the new expression as the dimension.
- Mark as New
- Bookmark
- Subscribe
- Mute
- Subscribe to RSS Feed
- Permalink
- Report Inappropriate Content
In the expression, in the Background color(click + on the expression). You can write conditional expression for the color for eg if(Monthname='Dec 2013',Green())
Ram