Unlock a world of possibilities! Login now and discover the exclusive benefits awaiting you.
Announcements
NEW: Seamless Public Data Sharing with Qlik's New Anonymous Access Capability:
TELL ME MORE!
- Qlik Community
- :
- All Forums
- :
- QlikView App Dev
- :
- Highlighting Values don't work for more than 1500 ...
Options
- Subscribe to RSS Feed
- Mark Topic as New
- Mark Topic as Read
- Float this Topic for Current User
- Bookmark
- Subscribe
- Mute
- Printer Friendly Page
Turn on suggestions
Auto-suggest helps you quickly narrow down your search results by suggesting possible matches as you type.
Showing results for
Partner - Contributor II
2014-01-15
05:15 AM
- Mark as New
- Bookmark
- Subscribe
- Mute
- Subscribe to RSS Feed
- Permalink
- Report Inappropriate Content
Highlighting Values don't work for more than 1500 values?
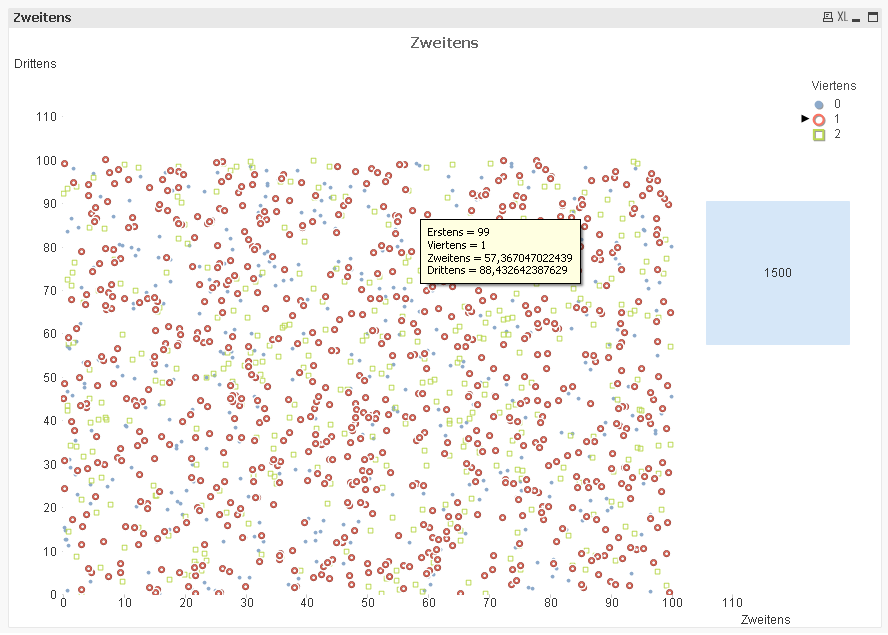
I have a Scatterchart with two dimensions and two Expressions, that looks like this:

As you can see, the highlighting of values with the same second dimensions works here. The Chart contains 1500 values.
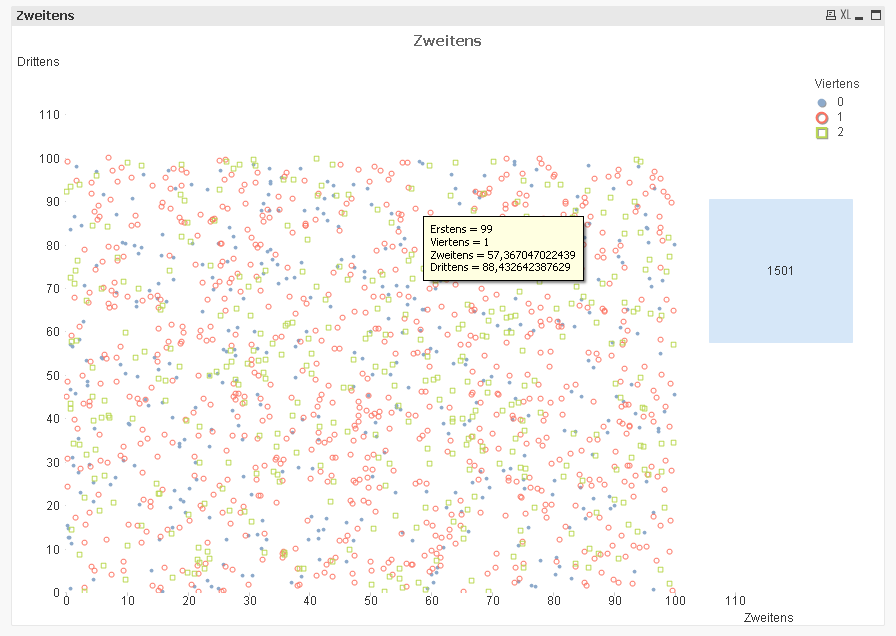
With one value more (1501) the same highlighting doesn't work anymore:

Is it possible to configure the amount of higlighted values?
Is it a restriction due to performance reasons?
In the Chart and Document properties I found no Setting for that.
Thanks,
Rafael
261 Views
0 Replies