Unlock a world of possibilities! Login now and discover the exclusive benefits awaiting you.
- Qlik Community
- :
- All Forums
- :
- QlikView App Dev
- :
- How can I edit and remove the unknown bar in the B...
- Subscribe to RSS Feed
- Mark Topic as New
- Mark Topic as Read
- Float this Topic for Current User
- Bookmark
- Subscribe
- Mute
- Printer Friendly Page
- Mark as New
- Bookmark
- Subscribe
- Mute
- Subscribe to RSS Feed
- Permalink
- Report Inappropriate Content
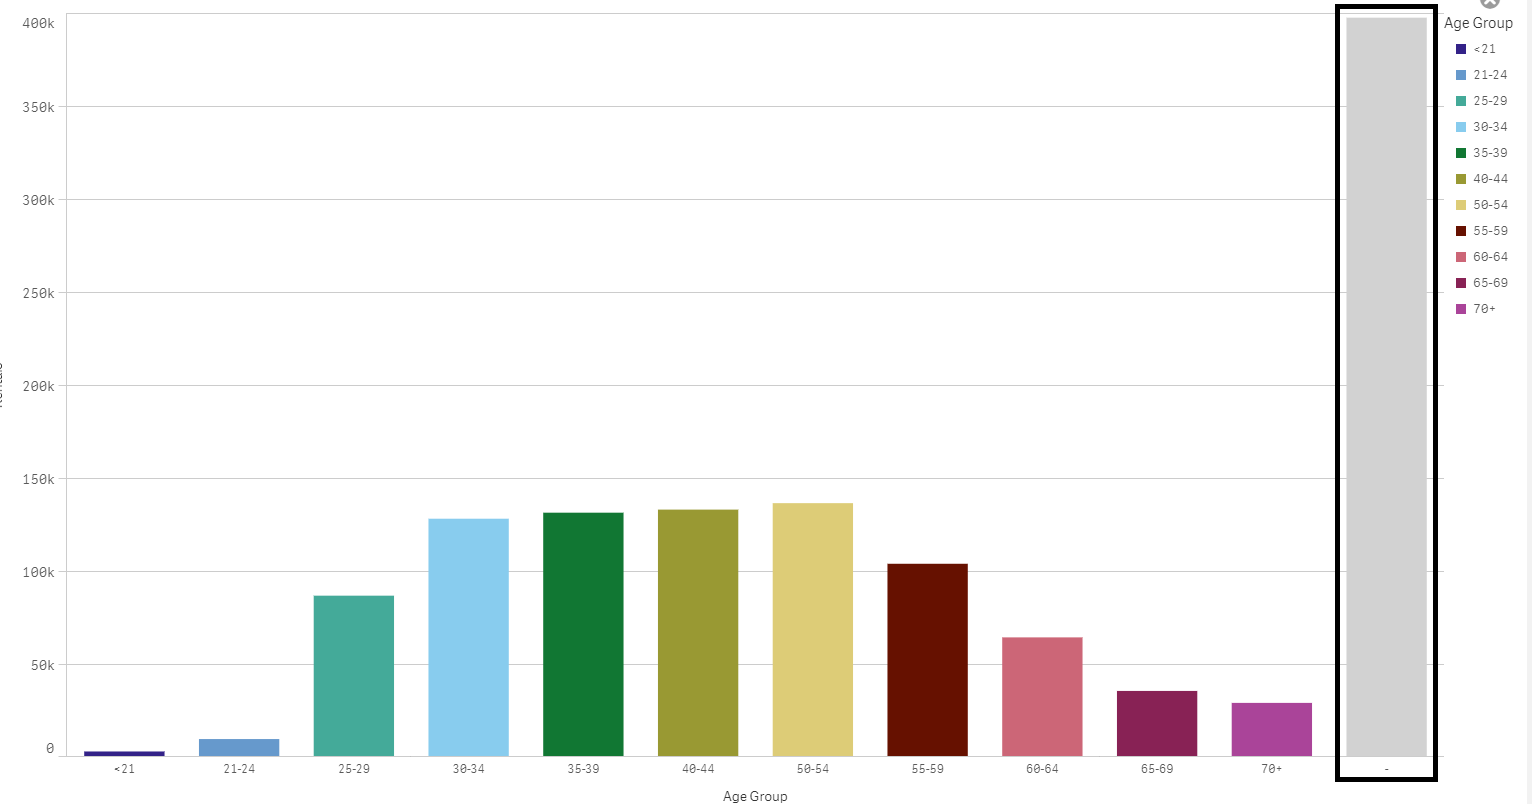
How can I edit and remove the unknown bar in the Bar Graph
Hi There,
I'm pretty much new to qlik. I'm bit struggling with frequency of age group bar chart. I find bit strange in the chart with grey bar which there no data allocated. And I can't even click on it see who are they. The script below is what I have used for the Graph.
Please if any could help me out. Would be really help.
=if (DRIVERAGE<21, '<21',
if (DRIVERAGE>=21 and DRIVERAGE<24, '21-24',
if (DRIVERAGE>=25 and DRIVERAGE<29, '25-29',
if (DRIVERAGE>=30 and DRIVERAGE<34, '30-34',
if (DRIVERAGE>=35 and DRIVERAGE<39, '35-39',
if (DRIVERAGE>=40 and DRIVERAGE<44, '40-44',
if (DRIVERAGE>=45 and DRIVERAGE<45, '45-49',
if (DRIVERAGE>=50 and DRIVERAGE<54, '50-54',
if (DRIVERAGE>=55 and DRIVERAGE<59, '55-59',
if (DRIVERAGE>=60 and DRIVERAGE<64, '60-64',
if (DRIVERAGE>=65 and DRIVERAGE<69, '65-69',
if (DRIVERAGE>=70, '70+'))))))))))))
Regards
NR
- Mark as New
- Bookmark
- Subscribe
- Mute
- Subscribe to RSS Feed
- Permalink
- Report Inappropriate Content
Hi
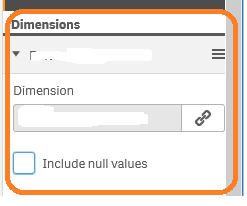
Can you try unchecking the null value option in dimension.
Refer attached screenshot
- Mark as New
- Bookmark
- Subscribe
- Mute
- Subscribe to RSS Feed
- Permalink
- Report Inappropriate Content
Hi Dude,
you need to Un-check the Null Values Option available in the Dimension Field.
Let us know if you face any issue .Else close the thread.
- Mark as New
- Bookmark
- Subscribe
- Mute
- Subscribe to RSS Feed
- Permalink
- Report Inappropriate Content
Hi,
saw your solution today. I was facing the same problem and my problem is solved.
thanks