Unlock a world of possibilities! Login now and discover the exclusive benefits awaiting you.
- Qlik Community
- :
- All Forums
- :
- QlikView App Dev
- :
- Re: How can I show percentages in a bar chart? Eve...
- Subscribe to RSS Feed
- Mark Topic as New
- Mark Topic as Read
- Float this Topic for Current User
- Bookmark
- Subscribe
- Mute
- Printer Friendly Page
- Mark as New
- Bookmark
- Subscribe
- Mute
- Subscribe to RSS Feed
- Permalink
- Report Inappropriate Content
How can I show percentages in a bar chart? Every column sum 100%
I need to show the percentages in every column of a bar chart.
This is my expression:
COUNT({<SampleType={'Tender'}>}DISTINCT [Sampling Order Header ID])
Please help.
- « Previous Replies
-
- 1
- 2
- Next Replies »
- Mark as New
- Bookmark
- Subscribe
- Mute
- Subscribe to RSS Feed
- Permalink
- Report Inappropriate Content
Hello Sunny
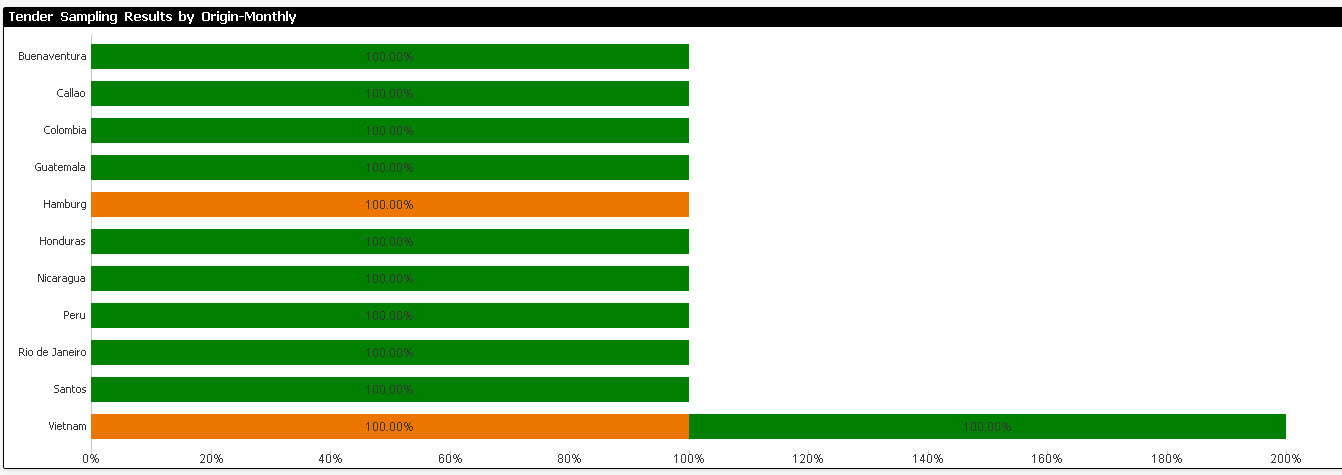
This is my chart.
I used your expression:
Count({<SampleType={'Tender'}>}DISTINCT [Sampling Order Header ID])
/Count(TOTAL <Origin> {<SampleType={'Tender'}>}DISTINCT [Sampling Order Header ID])
and did not work.
For Vietnam, I need 50% and 50%.
Please, help.

- Mark as New
- Bookmark
- Subscribe
- Mute
- Subscribe to RSS Feed
- Permalink
- Report Inappropriate Content
Are you using 2 expression and 1 dimension or 1 dimension or 2 expressions?
Can you share the how do you define your dimension and expressions?
- Mark as New
- Bookmark
- Subscribe
- Mute
- Subscribe to RSS Feed
- Permalink
- Report Inappropriate Content
2 dimensions: 1. Origin: IF(MATCH(SampleType,'Tender') AND LEN(Origin)>1, Origin)
2. Cupping Results : IF(MATCH(SampleType,'Tender ') AND LEN(Origin)>1,[Cupping Results])
1 expression:
Count({<SampleType={'Tender'}>}DISTINCT [Sampling Order Header ID])
/Count(TOTAL<Origin> {<SampleType={'Tender'}>}DISTINCT [Sampling Order Header ID])
- Mark as New
- Bookmark
- Subscribe
- Mute
- Subscribe to RSS Feed
- Permalink
- Report Inappropriate Content
Ouch! TOTAL does not work with calculated dimensions ![]()
If you can pre-calculate your dimensions in the script then you can use it.
Hope this helps!
- « Previous Replies
-
- 1
- 2
- Next Replies »