Unlock a world of possibilities! Login now and discover the exclusive benefits awaiting you.
- Qlik Community
- :
- All Forums
- :
- QlikView App Dev
- :
- Re: How can I show value for non related dimension
- Subscribe to RSS Feed
- Mark Topic as New
- Mark Topic as Read
- Float this Topic for Current User
- Bookmark
- Subscribe
- Mute
- Printer Friendly Page
- Mark as New
- Bookmark
- Subscribe
- Mute
- Subscribe to RSS Feed
- Permalink
- Report Inappropriate Content
How can I show value for non related dimension
Hi !
I have a not related value (Std Cost) to one of my dimension (PO Number), from different table as you can see in the straight table below
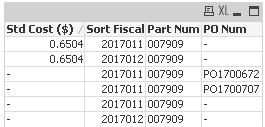
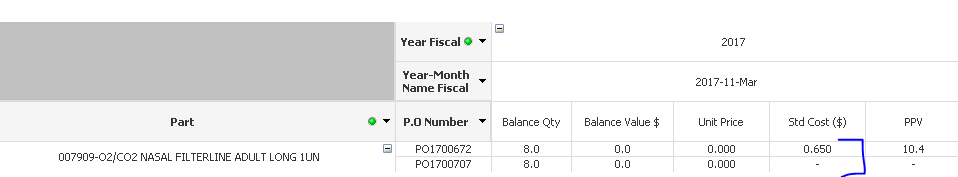
Then, when I create a pivot table this is the result I get:
If I collapse on part, the calculation is ok, but if I open to PO Number, my Std Cost (good value) appears only for the first line, and I want it to duplicate the value of the Std Cost on the part level.
Currently, this is the set analysis calculation for the Std cost:
MAX(AGGR([Std Cost ($)],[Part Num],[Sort Fiscal])
How to see the same standart cost for both of the lines please ?
Thank you !
Accepted Solutions
- Mark as New
- Bookmark
- Subscribe
- Mute
- Subscribe to RSS Feed
- Permalink
- Report Inappropriate Content
Can you try this:
Aggr(NODISTINCT [Std Cost ($)], [Part Num], [Sort Fiscal])
- Mark as New
- Bookmark
- Subscribe
- Mute
- Subscribe to RSS Feed
- Permalink
- Report Inappropriate Content
Try this:
Max(TOTAL <[Part Num]> Aggr([Std Cost ($)], [Part Num], [Sort Fiscal])
- Mark as New
- Bookmark
- Subscribe
- Mute
- Subscribe to RSS Feed
- Permalink
- Report Inappropriate Content
Please see the attached example, i've been lazy with my fieldnames sorry but the forumla:
=max(total <partnum> aggr(max(stdcost),partnum,sortfiscal ))
should work
- Mark as New
- Bookmark
- Subscribe
- Mute
- Subscribe to RSS Feed
- Permalink
- Report Inappropriate Content
Hi,
Thank you both, but in the screenshot I selected only one Part, but by applying your formula I get the same number for all my Parts.
In fact, I need one Std Cost for each Part and each Sort Fiscal (Year-Month)
Do you have any idea ?
Thank you
- Mark as New
- Bookmark
- Subscribe
- Mute
- Subscribe to RSS Feed
- Permalink
- Report Inappropriate Content
I tweaked mine slightly:
=max(total <partnum,sortfiscal> aggr(max(stdcost),partnum,sortfiscal ))
This seems to work in the attached example....
- Mark as New
- Bookmark
- Subscribe
- Mute
- Subscribe to RSS Feed
- Permalink
- Report Inappropriate Content
Can you try this:
Aggr(NODISTINCT [Std Cost ($)], [Part Num], [Sort Fiscal])
- Mark as New
- Bookmark
- Subscribe
- Mute
- Subscribe to RSS Feed
- Permalink
- Report Inappropriate Content
Yes in fact that's work, thank you but this is only work with the specific field Part Num, and I have a lot of others field in the chart (like Part Description, Main Family ...) and when I replace this, it give me back the highest of all data (1 value for all)
That is why I used AGGR, to say him the lowest level, and here, it seens to be very specific and only to Part Num
Do you have an idea ?