Unlock a world of possibilities! Login now and discover the exclusive benefits awaiting you.
- Qlik Community
- :
- All Forums
- :
- QlikView App Dev
- :
- How can I turn the values of a column into header ...
- Subscribe to RSS Feed
- Mark Topic as New
- Mark Topic as Read
- Float this Topic for Current User
- Bookmark
- Subscribe
- Mute
- Printer Friendly Page
- Mark as New
- Bookmark
- Subscribe
- Mute
- Subscribe to RSS Feed
- Permalink
- Report Inappropriate Content
How can I turn the values of a column into header of other columns?
I have one table like this:
| Year | Name | Value |
|---|---|---|
| 2016 | Adam | 1 |
| 2017 | Adam | 2 |
| 2018 | Adam | 3 |
| 2016 | Ben | 4 |
| 2017 | Ben | 5 |
| 2018 | Ben | 6 |
| 2016 | Carl | 7 |
| 2017 | Carl | 8 |
| 2018 | Carl | 9 |
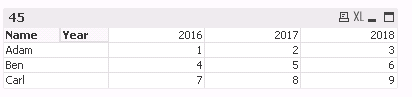
And I want to turn it into a table like this:
| Name | 2016 | 2017 | 2018 |
|---|---|---|---|
| Adam | 1 | 2 | 3 |
| Ben | 4 | 5 | 6 |
| Carl | 7 | 8 | 9 |
How can I do it?
Many thanks in advance.
- Tags:
- manipulate tables
Accepted Solutions
- Mark as New
- Bookmark
- Subscribe
- Mute
- Subscribe to RSS Feed
- Permalink
- Report Inappropriate Content
Why don't you simply use a pivot table. Like
add
Dimensions: Name, Year
Expr: Sum(Value)
Then drag your Year field to top of Expr.
- Mark as New
- Bookmark
- Subscribe
- Mute
- Subscribe to RSS Feed
- Permalink
- Report Inappropriate Content
use generic load like below
GenericTab:
Generic Load Name, Year, Value
FROM
[https://community.qlik.com/thread/297410]
(html, codepage is 1252, embedded labels, table is @1);
- Mark as New
- Bookmark
- Subscribe
- Mute
- Subscribe to RSS Feed
- Permalink
- Report Inappropriate Content
Does it works, being Value the result of an expression, rather than a "pure" variable?
- Mark as New
- Bookmark
- Subscribe
- Mute
- Subscribe to RSS Feed
- Permalink
- Report Inappropriate Content
Why don't you simply use a pivot table. Like
add
Dimensions: Name, Year
Expr: Sum(Value)
Then drag your Year field to top of Expr.
- Mark as New
- Bookmark
- Subscribe
- Mute
- Subscribe to RSS Feed
- Permalink
- Report Inappropriate Content
Sorry for my ignorance, but how I build/define a pivot table?
- Mark as New
- Bookmark
- Subscribe
- Mute
- Subscribe to RSS Feed
- Permalink
- Report Inappropriate Content
Done! Thanks!
- Mark as New
- Bookmark
- Subscribe
- Mute
- Subscribe to RSS Feed
- Permalink
- Report Inappropriate Content
Load your data as is. Like
LOAD Year, Name, Value
From yourtablename;
Then right click on sheet properties and select Chart.
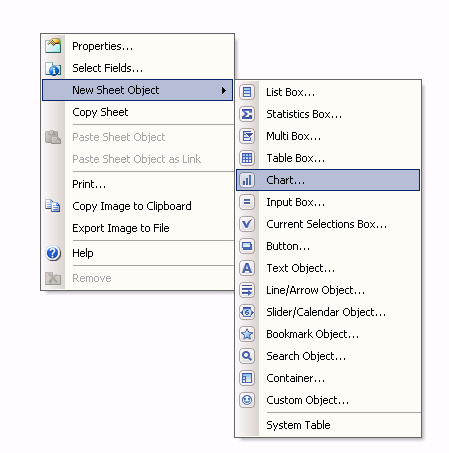
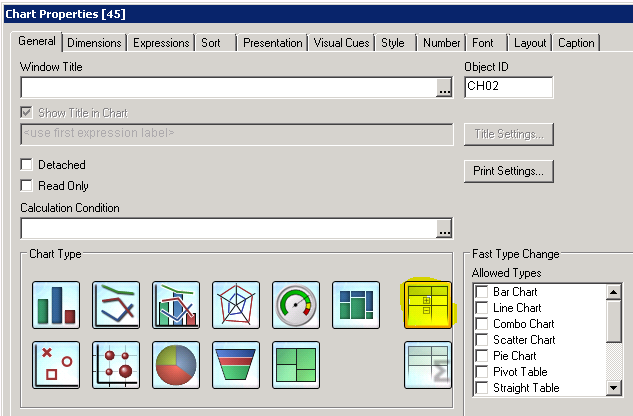
Then use Pivot table like below
Then in the dimensions tab you can see your fields
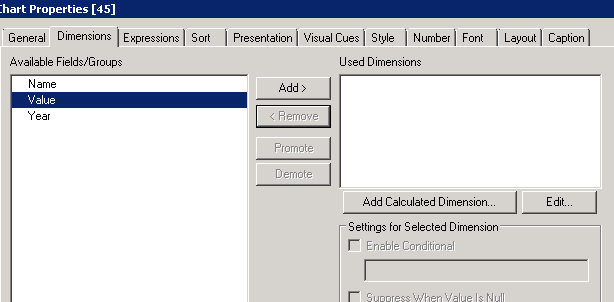
Then add Name and Year to your dimensions and in the expression tab
Add your expression like Sum(Value).
After that you have to drag your Year field to the top of expression.
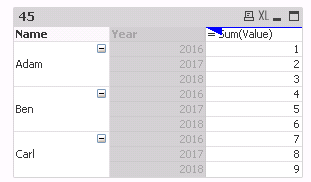
When you drag you can see a blue arrow like in the above screen shot. Just drag and drop on top of Exper Sum(Value)
- Mark as New
- Bookmark
- Subscribe
- Mute
- Subscribe to RSS Feed
- Permalink
- Report Inappropriate Content
Awesome. Cool.