Unlock a world of possibilities! Login now and discover the exclusive benefits awaiting you.
- Qlik Community
- :
- All Forums
- :
- QlikView App Dev
- :
- Re: How can I use data but not display it.
- Subscribe to RSS Feed
- Mark Topic as New
- Mark Topic as Read
- Float this Topic for Current User
- Bookmark
- Subscribe
- Mute
- Printer Friendly Page
- Mark as New
- Bookmark
- Subscribe
- Mute
- Subscribe to RSS Feed
- Permalink
- Report Inappropriate Content
How can I use data but not display it.
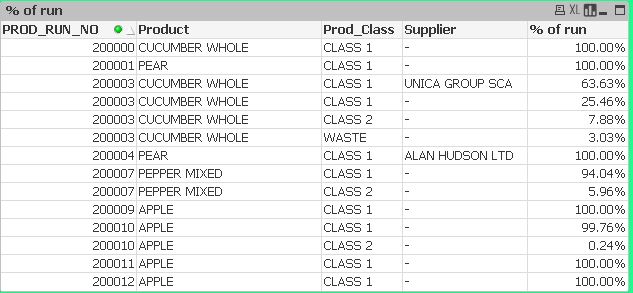
I have a set of data (below) in which I need to use the full set of data but I do now want to display all of it.
In the below data I need to use class 1, class 2 & waste to calculate the percentage produced, however I only want to display class 2 & waste in tables and charts (i.e.; use class 1 but hide it from view)
How would I go about this? Dimension limits only seem to refer to numerical based selections (top 10 etc.)
- « Previous Replies
-
- 1
- 2
- Next Replies »
- Mark as New
- Bookmark
- Subscribe
- Mute
- Subscribe to RSS Feed
- Permalink
- Report Inappropriate Content
Try this expression:
=Sum(Aggr(Sum({<Prod_Class -= {'CLASS 1'}>}RMInnerCount), ProductionRun, Product, Prod_Class))/Sum({1}Aggr(Sum({1}TOTAL <ProductionRun> RMInnerCount), ProductionRun, Product, Prod_Class))
Dimension
Product
Prod_Class
- Mark as New
- Bookmark
- Subscribe
- Mute
- Subscribe to RSS Feed
- Permalink
- Report Inappropriate Content
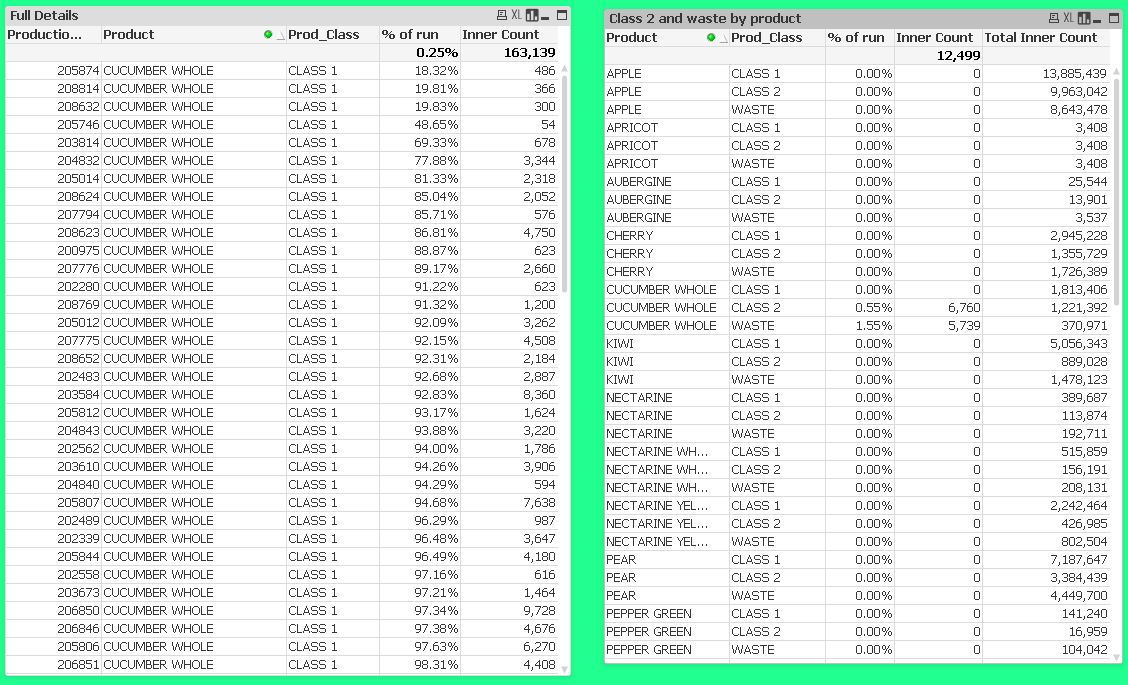
This isn't quite working to give the right result.
I have split the formula into two parts in the table to see why - the first part (Sum(Aggr(Sum({<Prod_Class -= {'CLASS 1'}>}RMInnerCount), ProductionRun, Product, Prod_Class)) - inner count in table) is OK - however the 2nd part (Sum({1}Aggr(Sum({1}TOTAL <ProductionRun> RMInnerCount), ProductionRun, Product, Prod_Class)) - total inner count in table) is returning the wrong figures still -should be 163,139 for cucumber.
I'm guessing the issue is with the identifiers so I'll play around a bit with these.
- Mark as New
- Bookmark
- Subscribe
- Mute
- Subscribe to RSS Feed
- Permalink
- Report Inappropriate Content
What about this:
=Sum(Aggr(Sum({<Prod_Class -= {'CLASS 1'}>}RMInnerCount), ProductionRun, Product, Prod_Class))/Sum({1}TOTAL <Product> Aggr(Sum({1}TOTAL <ProductionRun> RMInnerCount), ProductionRun, Product, Prod_Class))
- Mark as New
- Bookmark
- Subscribe
- Mute
- Subscribe to RSS Feed
- Permalink
- Report Inappropriate Content
Or maybe remove the TOTAL qualifier from the inner aggregation:
=Sum({1}TOTAL <Product> Aggr(Sum({1} RMInnerCount), ProductionRun, Product, Prod_Class))
- Mark as New
- Bookmark
- Subscribe
- Mute
- Subscribe to RSS Feed
- Permalink
- Report Inappropriate Content
Both of these answers are now giving me the same result for each class, but it's still not the right result.
Correct answer for Total inner count (to divide by) is 227,008 for data selected.
Swuehl's answer is giving me 298,826
Sunny T's answer is giving me 429,906.
I have stripped out a load of data and will attach the report for assessing.
- Mark as New
- Bookmark
- Subscribe
- Mute
- Subscribe to RSS Feed
- Permalink
- Report Inappropriate Content
File attached
- Mark as New
- Bookmark
- Subscribe
- Mute
- Subscribe to RSS Feed
- Permalink
- Report Inappropriate Content
Maybe just remove the set analysis:
=Sum(TOTAL<Product> Aggr(Sum(FPInnerCount),ProductionRun,Product,Prod_Class))
- Mark as New
- Bookmark
- Subscribe
- Mute
- Subscribe to RSS Feed
- Permalink
- Report Inappropriate Content
Still not returning correct data unless filtered by an early run. It seems to use earlier runs as part of the data (i.e.; not restricting to production run but using earlier runs as part of the data)
I kept playing around with your formula above and the below works
Sum(ALL<Product>Aggr(Sum({<Prod_Class>}FPInnerCount),ProductionRun,Product,Prod_Class))
Not sure why this works but I just kept throwing things at it until something stuck.
Thanks to both of you for your help - it gave me stepping stones along the way and I would never have got anywhere without them.
- Mark as New
- Bookmark
- Subscribe
- Mute
- Subscribe to RSS Feed
- Permalink
- Report Inappropriate Content
I am not sure what you are seeing, but I am seeing the same results based on Stefan's expression (with addition of the inner set analysis)
=Sum(TOTAL<Product> Aggr(Sum({<Prod_Class>}FPInnerCount),ProductionRun,Product,Prod_Class))
vs. yours
Sum(ALL<Product>Aggr(Sum({<Prod_Class>}FPInnerCount),ProductionRun,Product,Prod_Class))
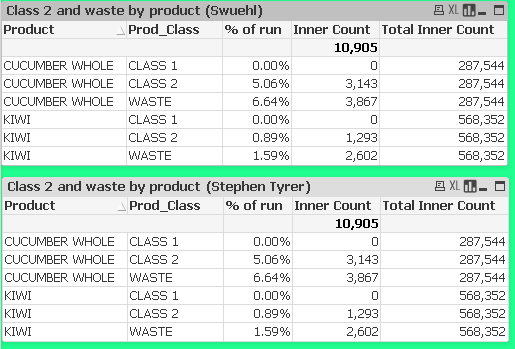
Tried clearing out some selections and did not find any differences in the number. What selections are making the two expressions deviate for you?
- Mark as New
- Bookmark
- Subscribe
- Mute
- Subscribe to RSS Feed
- Permalink
- Report Inappropriate Content
The ALL qualifier is deprecated and should not be used anymore.
Not sure if it has supported a field list ('ALL<Product>'), AFAIK, ALL is a synonym for {1} TOTAL
- « Previous Replies
-
- 1
- 2
- Next Replies »