Unlock a world of possibilities! Login now and discover the exclusive benefits awaiting you.
- Qlik Community
- :
- All Forums
- :
- QlikView App Dev
- :
- Re: How can i get count customers in an evoluition...
- Subscribe to RSS Feed
- Mark Topic as New
- Mark Topic as Read
- Float this Topic for Current User
- Bookmark
- Subscribe
- Mute
- Printer Friendly Page
- Mark as New
- Bookmark
- Subscribe
- Mute
- Subscribe to RSS Feed
- Permalink
- Report Inappropriate Content
How can i get count customers in an evoluition of the time?
Hi all! How are you doing?!
I have a cloud that presents the following dates:
Customer ID
Inclusion Dates
Exclusion Dates
Type (Client classification) (gold / bronze)
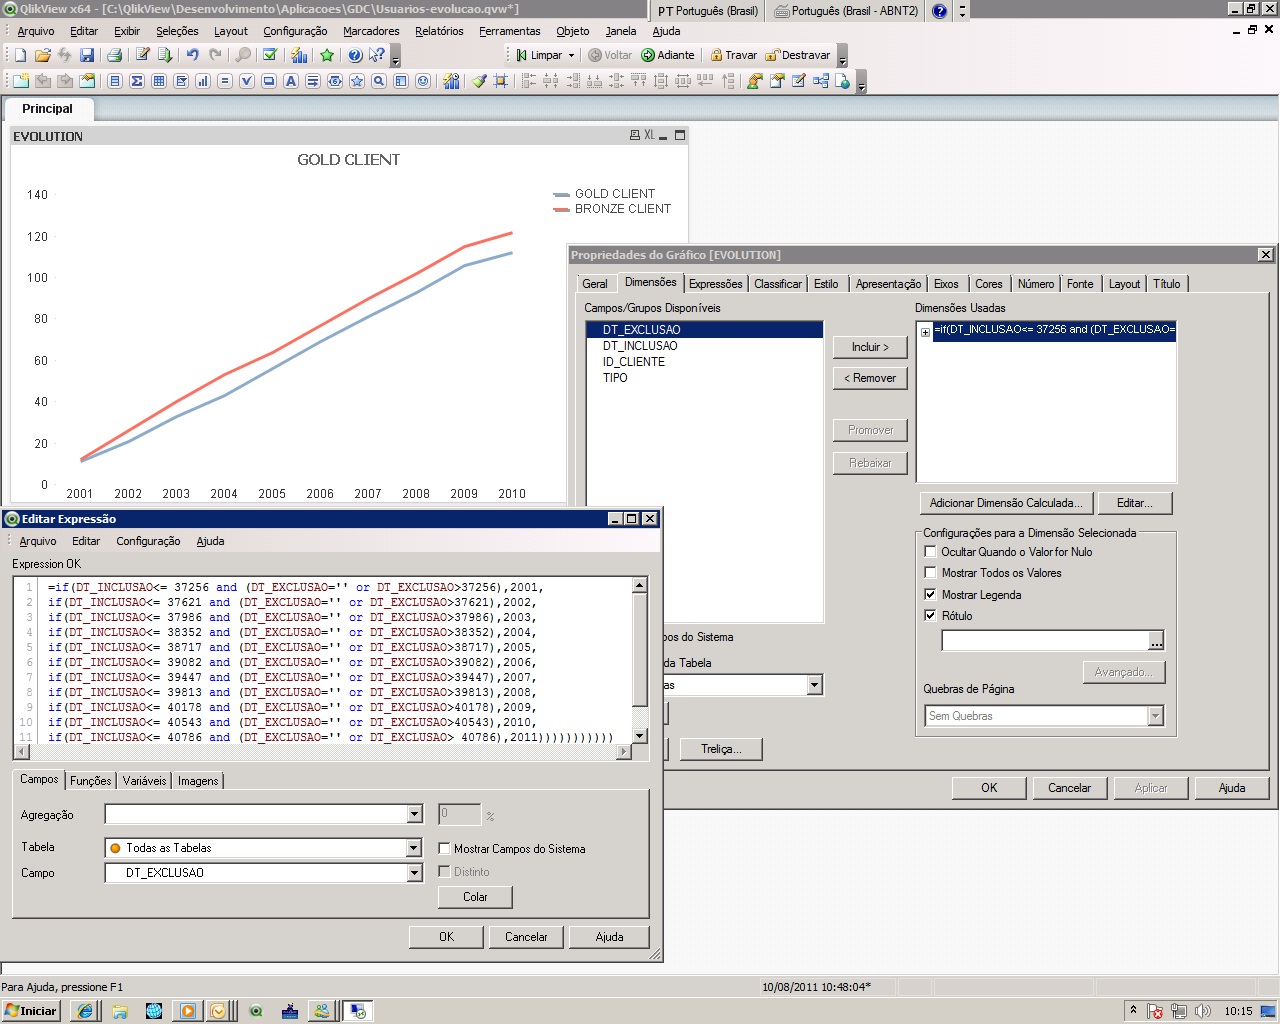
I need to count these customers in an evolution of time, to make a line graphs that shows the evolution, along the years, in two lines: the line of the amount of gold customers and the line of the amount of bronze customers.
To construct the graph, i have as dimension the years (where the amounts of customers will be contained) and as expression will be two: amount of gold customers / amount of bronze customers .
For the customer to belong in one year in subject, he needs to have date of smaller inclusion or same to the last day of this year
and to have the date of exclusion empty or larger than the last day of this year.
My problem is:
A customer that entered in 01.01.1999 and it stays active until today , the client needs to count in every year.
I attached a picture trying to show the dimension that i used. The dimension was used for all the field/groups.
Regards
Minzinfi
Accepted Solutions
- Mark as New
- Bookmark
- Subscribe
- Mute
- Subscribe to RSS Feed
- Permalink
- Report Inappropriate Content
As I said, "you can either only include last days of years, or flag them similar to how I flag the hire date of an employee". Here's the example updated with the flag approach. See the second chart.
- Mark as New
- Bookmark
- Subscribe
- Mute
- Subscribe to RSS Feed
- Permalink
- Report Inappropriate Content
The attached application may help. It does more than you need, but I think the first line chart is very similar to what you want. Female and Male are like your gold and bronze client classifications. I'm not sure I'm doing the exact count you're looking for - I include the employee in the year if they were employed at any time during the year, not just the last day of the year which it sounds like is what you want. But you can either only include last days of years, or flag them similar to how I flag the hire date of an employee, and then use this to count employee hires.
- Mark as New
- Bookmark
- Subscribe
- Mute
- Subscribe to RSS Feed
- Permalink
- Report Inappropriate Content
Hi John!
Thanks a lot for the answer! But, help me again! I have a doubt.. Is there a possbility to know the number that employees that was hired and fired in the end of the year? How can i say.. like a people balance?
BALANCE 2007 DECEMBER : 210
DURING THE YEAR (2008): 150 hired and 80 fired : BALANCE: 280 emplooyes, and use the same reasoning for the years 2009, 2010 etc.
Did you get it?
Thanks a lot John!
- Mark as New
- Bookmark
- Subscribe
- Mute
- Subscribe to RSS Feed
- Permalink
- Report Inappropriate Content
Hi John!
Thanks a lot for the answer! But, help me again! I have a doubt.. Is there a possibility to know the number that employees that was hired and fired in the end of the year? How can i say.. like a people balance?
BALANCE 2007 DECEMBER : 210
DURING THE YEAR (2008): 150 hired and 80 fired : BALANCE: 280 employees, and use the same reasoning for the years 2009, 2010 etc.
Did you get it?
Thanks a lot John!
Enviada em: quinta-feira, 11 de agosto de 2011 21:00
Para: LOND-GDC- Alexandre Menoncin
Assunto: - Re: How can i get count customers in an evoluition of the time?
QlikCommunity <http://community.qlik.com/index.jspa>
Re: How can i get count customers in an evoluition of the time?
created by John Witherspoon <http://community.qlik.com/people/johnw> in Development (QlikView Desktop) - View the full discussion <http://community.qlik.com/message/140454#140454
- Mark as New
- Bookmark
- Subscribe
- Mute
- Subscribe to RSS Feed
- Permalink
- Report Inappropriate Content
As I said, "you can either only include last days of years, or flag them similar to how I flag the hire date of an employee". Here's the example updated with the flag approach. See the second chart.
- Mark as New
- Bookmark
- Subscribe
- Mute
- Subscribe to RSS Feed
- Permalink
- Report Inappropriate Content
Thanks a lot John!
Regards,