Unlock a world of possibilities! Login now and discover the exclusive benefits awaiting you.
- Qlik Community
- :
- All Forums
- :
- QlikView App Dev
- :
- Re: How can we give two different colors for the d...
- Subscribe to RSS Feed
- Mark Topic as New
- Mark Topic as Read
- Float this Topic for Current User
- Bookmark
- Subscribe
- Mute
- Printer Friendly Page
- Mark as New
- Bookmark
- Subscribe
- Mute
- Subscribe to RSS Feed
- Permalink
- Report Inappropriate Content
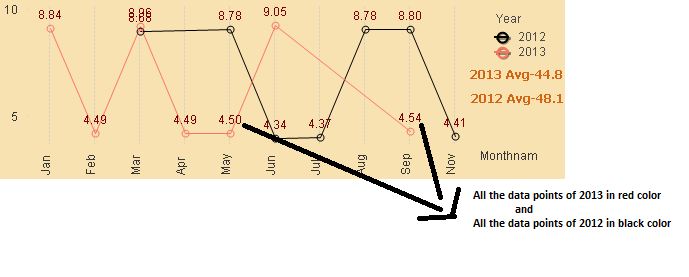
How can we give two different colors for the data points in a line chart shown in Example below

From the above example shown I need to keep two diferent colors for different years. Lets say all the data point values of 2013 (8.84,4.49,8.68,4.49,4.50,9.05,4.54) should be displayed in RED color and the data points for 2012 should be dispalyed in black.
Can Some one suggest me how to do this/
Thank you,
David. G
Accepted Solutions
- Mark as New
- Bookmark
- Subscribe
- Mute
- Subscribe to RSS Feed
- Permalink
- Report Inappropriate Content
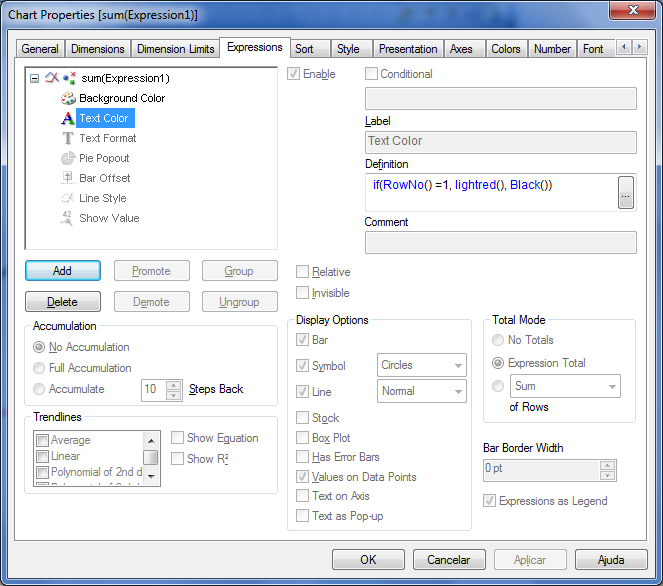
Here you go, no need for two expressions.
Edit: Change the text color expression for your expression..
- Mark as New
- Bookmark
- Subscribe
- Mute
- Subscribe to RSS Feed
- Permalink
- Report Inappropriate Content
Hi David,
Create a Line chart. (Right click --> New sheet object --> Chart; then select line chart in the General options)
Add month as a dimension.
Add one expression as Sum({$<Year={2012}>} Sales).
Add another expression as Sum({$<Year={2013}>} Sales)
In the expression tab, check the "Symbol" and select circles from the dropdown. Select "Values on data points". (on both the expressions)
Go to Colors tab and change the first color to black and second color to red.
If you want the years to be dynamic, create a variable
vCurrentYear=Year(today())
vLastYear=Year(today())-1
In the expressions, use Sum({$<Year={$(vCurrentYear)}>} Sales) and Sum({$<Year={$(vLastYear)}>} Sales)
Cheers!
- Mark as New
- Bookmark
- Subscribe
- Mute
- Subscribe to RSS Feed
- Permalink
- Report Inappropriate Content
Manas BN,
Thankyou for your response. I have already achieved this line chart with different colors for two years 2012 and 2013. But I would like to keep data points in two different colors for each of the years.
- Mark as New
- Bookmark
- Subscribe
- Mute
- Subscribe to RSS Feed
- Permalink
- Report Inappropriate Content

I ve tried changing the colors in Colors tab and change the first color to black and second color to red but its only changing the colors of lines but not data points.
- Mark as New
- Bookmark
- Subscribe
- Mute
- Subscribe to RSS Feed
- Permalink
- Report Inappropriate Content
Here you go, no need for two expressions.
Edit: Change the text color expression for your expression..
- Mark as New
- Bookmark
- Subscribe
- Mute
- Subscribe to RSS Feed
- Permalink
- Report Inappropriate Content
Expand your expression and set "Text Color"
