Unlock a world of possibilities! Login now and discover the exclusive benefits awaiting you.
- Qlik Community
- :
- All Forums
- :
- QlikView App Dev
- :
- How can you include all rows of a group if any mat...
- Subscribe to RSS Feed
- Mark Topic as New
- Mark Topic as Read
- Float this Topic for Current User
- Bookmark
- Subscribe
- Mute
- Printer Friendly Page
- Mark as New
- Bookmark
- Subscribe
- Mute
- Subscribe to RSS Feed
- Permalink
- Report Inappropriate Content
How can you include all rows of a group if any match a user defined selection?
Hey everyone,
I'm trying to create a chart that will eliminate zero values based on a user's year selection.
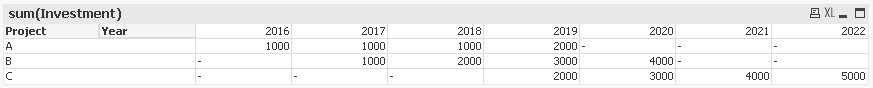
I am trying to make it so that if, for example, a user picked Year 2022, then only project C would show. However, project C should still show data in all other columns.
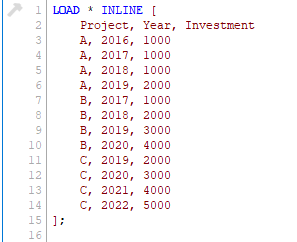
Basically, I would like to remove zero investment values from any column the user selects without removing the projects overall investment forecast. The data is currently formatted as below.
I've tried using group by in the script to create flags, aggr calculated dimensions, and several other options, however I seem to only be able to display all data for a given column if I zero out the other columns. Do any of you have any suggestions?
Thank you
- Tags:
- grouping rows