Unlock a world of possibilities! Login now and discover the exclusive benefits awaiting you.
Announcements
Only at Qlik Connect! Guest keynote Jesse Cole shares his secrets for daring to be different. Learn More!
- Qlik Community
- :
- All Forums
- :
- QlikView App Dev
- :
- Re: How display a graphic when i select another va...
Options
- Subscribe to RSS Feed
- Mark Topic as New
- Mark Topic as Read
- Float this Topic for Current User
- Bookmark
- Subscribe
- Mute
- Printer Friendly Page
Turn on suggestions
Auto-suggest helps you quickly narrow down your search results by suggesting possible matches as you type.
Showing results for
Creator
2016-07-21
07:16 PM
- Mark as New
- Bookmark
- Subscribe
- Mute
- Subscribe to RSS Feed
- Permalink
- Report Inappropriate Content
How display a graphic when i select another value of graphics
Hello.
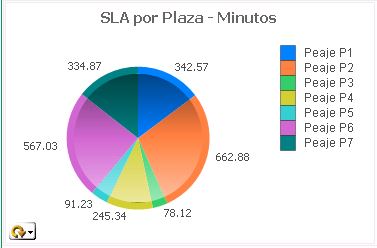
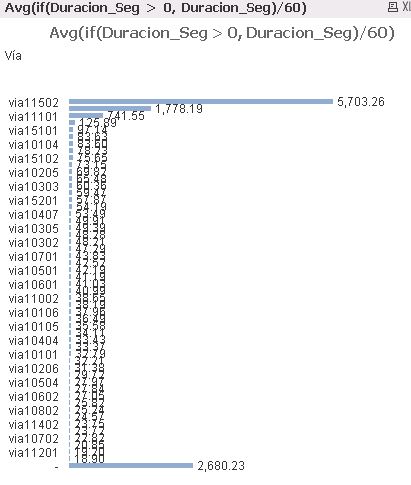
Need your help. I Have two graphics with information and for default show data in both.
I need display in blank the Graph 2 and only display data when i select one piece of the graphic 1.
Sorry, my english is not good.
Graph1
Graph 2
560 Views
1 Solution
Accepted Solutions
Partner - Specialist
2016-07-22
03:34 AM
- Mark as New
- Bookmark
- Subscribe
- Mute
- Subscribe to RSS Feed
- Permalink
- Report Inappropriate Content
492 Views
4 Replies
Not applicable
2016-07-22
03:33 AM
- Mark as New
- Bookmark
- Subscribe
- Mute
- Subscribe to RSS Feed
- Permalink
- Report Inappropriate Content
You may use show condition in property of second chart (under tab, Layout). Instead of "Always" show, you may choose "conditional" with expression: len(GetFieldSelections([Peaje P field]))>0, where [Peaje P field] is the field used as dimension in the first chart.
492 Views
Partner - Specialist
2016-07-22
03:34 AM
- Mark as New
- Bookmark
- Subscribe
- Mute
- Subscribe to RSS Feed
- Permalink
- Report Inappropriate Content
Hi Jose,
PFA
Warm Regards,
Susovan
Susovan
493 Views
Master II
2016-07-22
03:39 AM
- Mark as New
- Bookmark
- Subscribe
- Mute
- Subscribe to RSS Feed
- Permalink
- Report Inappropriate Content
Hi Jose,
have a look at the attached sample.
hope this helps!
492 Views
Creator
2016-07-22
09:07 AM
Author
- Mark as New
- Bookmark
- Subscribe
- Mute
- Subscribe to RSS Feed
- Permalink
- Report Inappropriate Content
Thanks!!!.. Its work 
492 Views