Unlock a world of possibilities! Login now and discover the exclusive benefits awaiting you.
Announcements
Independent validation for trusted, AI-ready data integration. See why IDC named Qlik a Leader: Read the Excerpt!
- Qlik Community
- :
- All Forums
- :
- QlikView App Dev
- :
- Re: How display a graphic when i select another va...
Options
- Subscribe to RSS Feed
- Mark Topic as New
- Mark Topic as Read
- Float this Topic for Current User
- Bookmark
- Subscribe
- Mute
- Printer Friendly Page
Turn on suggestions
Auto-suggest helps you quickly narrow down your search results by suggesting possible matches as you type.
Showing results for
Creator
2016-07-21
07:16 PM
- Mark as New
- Bookmark
- Subscribe
- Mute
- Subscribe to RSS Feed
- Permalink
- Report Inappropriate Content
How display a graphic when i select another value of graphics
Hello.
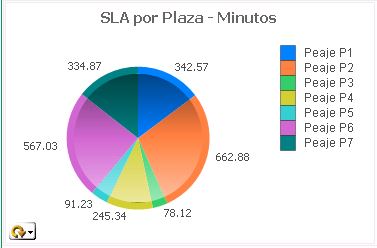
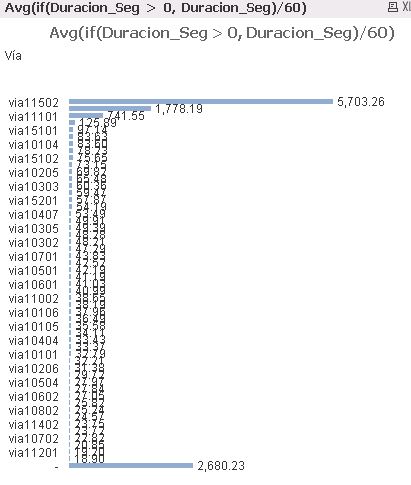
Need your help. I Have two graphics with information and for default show data in both.
I need display in blank the Graph 2 and only display data when i select one piece of the graphic 1.
Sorry, my english is not good.
Graph1
Graph 2
562 Views
1 Solution
Accepted Solutions
Partner - Specialist
2016-07-22
03:34 AM
- Mark as New
- Bookmark
- Subscribe
- Mute
- Subscribe to RSS Feed
- Permalink
- Report Inappropriate Content
494 Views
4 Replies
Not applicable
2016-07-22
03:33 AM
- Mark as New
- Bookmark
- Subscribe
- Mute
- Subscribe to RSS Feed
- Permalink
- Report Inappropriate Content
You may use show condition in property of second chart (under tab, Layout). Instead of "Always" show, you may choose "conditional" with expression: len(GetFieldSelections([Peaje P field]))>0, where [Peaje P field] is the field used as dimension in the first chart.
494 Views
Partner - Specialist
2016-07-22
03:34 AM
- Mark as New
- Bookmark
- Subscribe
- Mute
- Subscribe to RSS Feed
- Permalink
- Report Inappropriate Content
Hi Jose,
PFA
Warm Regards,
Susovan
Susovan
495 Views
Master II
2016-07-22
03:39 AM
- Mark as New
- Bookmark
- Subscribe
- Mute
- Subscribe to RSS Feed
- Permalink
- Report Inappropriate Content
Hi Jose,
have a look at the attached sample.
hope this helps!
494 Views
Creator
2016-07-22
09:07 AM
Author
- Mark as New
- Bookmark
- Subscribe
- Mute
- Subscribe to RSS Feed
- Permalink
- Report Inappropriate Content
Thanks!!!.. Its work 
494 Views