Unlock a world of possibilities! Login now and discover the exclusive benefits awaiting you.
- Qlik Community
- :
- All Forums
- :
- QlikView App Dev
- :
- Re: How do I ask about LAST MONTH?
- Subscribe to RSS Feed
- Mark Topic as New
- Mark Topic as Read
- Float this Topic for Current User
- Bookmark
- Subscribe
- Mute
- Printer Friendly Page
- Mark as New
- Bookmark
- Subscribe
- Mute
- Subscribe to RSS Feed
- Permalink
- Report Inappropriate Content
How do I ask about LAST MONTH?
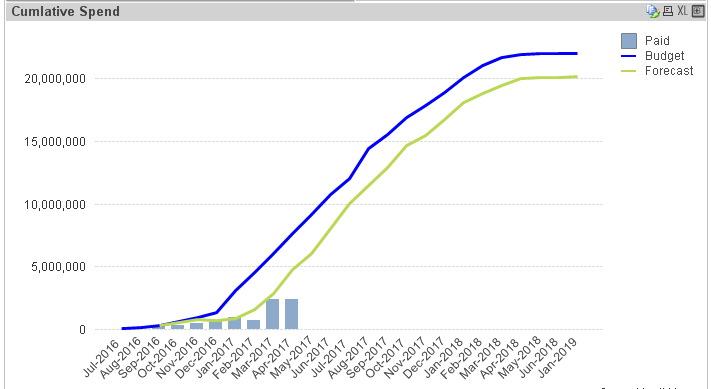
I have a graph with 3 lines - Budget, Forecast, Paid (actuals) - see chart below. For Budget and Forecast it shows the whole of the project, by month. For Paid, I want to show just the last month I have full transactions for - "LAST MONTH".
THIS FORMULA
=If(CanonMonthYear <= Today(), RangeSum(Above(Sum(TrxnAmount), 0, RowNo())))
...It works -
- it shows me actuals.
- the bars stop at THIS MONTH. (April in the chart below)
I want it to stop at LAST MONTH. How can I change "Today" to Last month? I want the bars below to stop at March.
Accepted Solutions
- Mark as New
- Bookmark
- Subscribe
- Mute
- Subscribe to RSS Feed
- Permalink
- Report Inappropriate Content
May be like this
=If(CanonMonthYear < MonthStart(Today()), RangeSum(Above(Sum(TrxnAmount), 0, RowNo())))
- Mark as New
- Bookmark
- Subscribe
- Mute
- Subscribe to RSS Feed
- Permalink
- Report Inappropriate Content
May be like this
=If(CanonMonthYear < MonthStart(Today()), RangeSum(Above(Sum(TrxnAmount), 0, RowNo())))
- Mark as New
- Bookmark
- Subscribe
- Mute
- Subscribe to RSS Feed
- Permalink
- Report Inappropriate Content
THANKS! it worked!