Unlock a world of possibilities! Login now and discover the exclusive benefits awaiting you.
- Qlik Community
- :
- All Forums
- :
- QlikView App Dev
- :
- How do I display last 30 days, but accumulate from...
- Subscribe to RSS Feed
- Mark Topic as New
- Mark Topic as Read
- Float this Topic for Current User
- Bookmark
- Subscribe
- Mute
- Printer Friendly Page
- Mark as New
- Bookmark
- Subscribe
- Mute
- Subscribe to RSS Feed
- Permalink
- Report Inappropriate Content
How do I display last 30 days, but accumulate from entire data set in a chart
I am tasked with creating some metrics based on currently selected data.
Currently I use an "auto-sizing" dimension variable that changes the chart dimension based on how much data is available. I am also (thanks to help from here) now able to accumulate proper numbers over time. I allow the users to select several different fields from list boxes to narrow down what the chart shows.
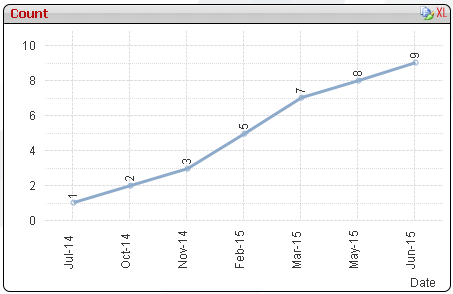
What I need to do now is shrink the visible window in the chart to the past 30 days, but accumulate over the entire data set so that the last number display is the current total of all issues based on selections. Below is a copy of my chart, and the dimension I currently use.
Based on experimentation, if I use set analysis in my expression and use the 1, it would appear to invalidate selections made by the user. I currently use the $ to do analysis based on current selections.
How do I limit my view to 30 days without impacting my accumulated values?
Expression:
Count(DISTINCT {$<[Target Gate] = {'Alpha - platform'}>} [Master ID])
Dimension:
=if(GetPossibleCount([CreatedDate]) <=36, Date([CreatedDate], 'YYYY-MM-DD'),
if(GetPossibleCount([Created MonthYear]) <= 36, Date([Created MonthYear],'MMM-YY'),
[Year]
)
)

- « Previous Replies
-
- 1
- 2
- Next Replies »
- Mark as New
- Bookmark
- Subscribe
- Mute
- Subscribe to RSS Feed
- Permalink
- Report Inappropriate Content
That definitely cleared quite a few things up. I never thought to use a text object to vet expressions (was actually looking for a way to do that).
Quite a handy tip.
- Mark as New
- Bookmark
- Subscribe
- Mute
- Subscribe to RSS Feed
- Permalink
- Report Inappropriate Content
Glad you were able to learn a new trick here today ![]()
Best,
Sunny
- Mark as New
- Bookmark
- Subscribe
- Mute
- Subscribe to RSS Feed
- Permalink
- Report Inappropriate Content
If(Count(DISTINCT {<Date = {"$(='>=' & Date(AddMonths(MonthStart(Max(Date)), -1)) & '<=' & Date(MonthEnd(Max(Date))))"}, MonthYear = >}[Master ID]) > 0,
RangeSum(Above(Count(DISTINCT {<MonthYear = >} [Master ID]), 0, RowNo())))
this expression actually helped me for one of the instances. thanks a lot
- « Previous Replies
-
- 1
- 2
- Next Replies »