Unlock a world of possibilities! Login now and discover the exclusive benefits awaiting you.
- Qlik Community
- :
- All Forums
- :
- QlikView App Dev
- :
- Re: How do I keep months from disappearing from a ...
- Subscribe to RSS Feed
- Mark Topic as New
- Mark Topic as Read
- Float this Topic for Current User
- Bookmark
- Subscribe
- Mute
- Printer Friendly Page
- Mark as New
- Bookmark
- Subscribe
- Mute
- Subscribe to RSS Feed
- Permalink
- Report Inappropriate Content
How do I keep months from disappearing from a bar chart?
I have a bar chart with months going from left to right. Showing "resource effort" by month.
When I filter on one project, the month of January disappears from the bar chart, because there are no resources assigned to that project for January. I would like to keep January in the chart, how do I do that?
Accepted Solutions
- Mark as New
- Bookmark
- Subscribe
- Mute
- Subscribe to RSS Feed
- Permalink
- Report Inappropriate Content
Also in Dimension tab flag "Show All Values" and "Suppress ...."
- Mark as New
- Bookmark
- Subscribe
- Mute
- Subscribe to RSS Feed
- Permalink
- Report Inappropriate Content
It usually means you've no data to represent for the Month of Jan.
You can show Jan Month but it will be a 0
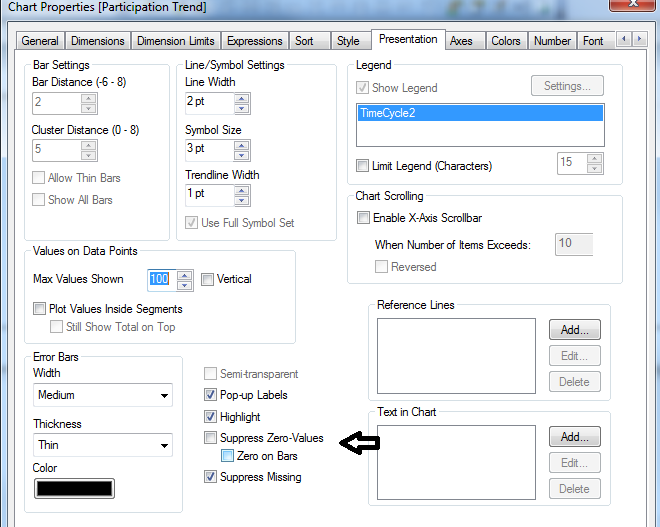
Uncheck the Suppress Zero Values in Presentation Tab, it will show Jan but with no bar or line.
- Mark as New
- Bookmark
- Subscribe
- Mute
- Subscribe to RSS Feed
- Permalink
- Report Inappropriate Content
Is that box checked by default? Mine is unchecked already. I should add my underlying data in excel doesn't have January in the "calendar month" column when filter on that one project. Is that why Qlik isn't showing January when I filter on that project. None the less i'd like it to appear on the bar chart even if it has zero data in Qlik.
- Mark as New
- Bookmark
- Subscribe
- Mute
- Subscribe to RSS Feed
- Permalink
- Report Inappropriate Content
Also in Dimension tab flag "Show All Values" and "Suppress ...."
- Mark as New
- Bookmark
- Subscribe
- Mute
- Subscribe to RSS Feed
- Permalink
- Report Inappropriate Content
Yes it is by default and if you do not have Month January in data/calendar then I don't think you'll see Jan.
- Mark as New
- Bookmark
- Subscribe
- Mute
- Subscribe to RSS Feed
- Permalink
- Report Inappropriate Content
Ok, but remember, January appears when everything is unfiltered, because some projects have January. If i look at my excel spreadsheet unfiltered I see January. So continuing in excel, if I filter on project XYZ, January disappears in excel.
There is no way to keep january from disappearing in qlikview if I filter on XYZ? Because thats how it behaves in my excel file?
- Mark as New
- Bookmark
- Subscribe
- Mute
- Subscribe to RSS Feed
- Permalink
- Report Inappropriate Content
this worked. thank you.