Unlock a world of possibilities! Login now and discover the exclusive benefits awaiting you.
- Qlik Community
- :
- All Forums
- :
- QlikView App Dev
- :
- Re: How to Create different charts for different s...
- Subscribe to RSS Feed
- Mark Topic as New
- Mark Topic as Read
- Float this Topic for Current User
- Bookmark
- Subscribe
- Mute
- Printer Friendly Page
- Mark as New
- Bookmark
- Subscribe
- Mute
- Subscribe to RSS Feed
- Permalink
- Report Inappropriate Content
How to Create different charts for different selection in a sheet?
Hi ,
Is there any way of creating different charts for different selections in the same sheet of Qlikview document.
My requirement is to display relevant chart with respect to a particular selection hiding the other charts.
Thanks,
Vaneet
- « Previous Replies
-
- 1
- 2
- Next Replies »
Accepted Solutions
- Mark as New
- Bookmark
- Subscribe
- Mute
- Subscribe to RSS Feed
- Permalink
- Report Inappropriate Content
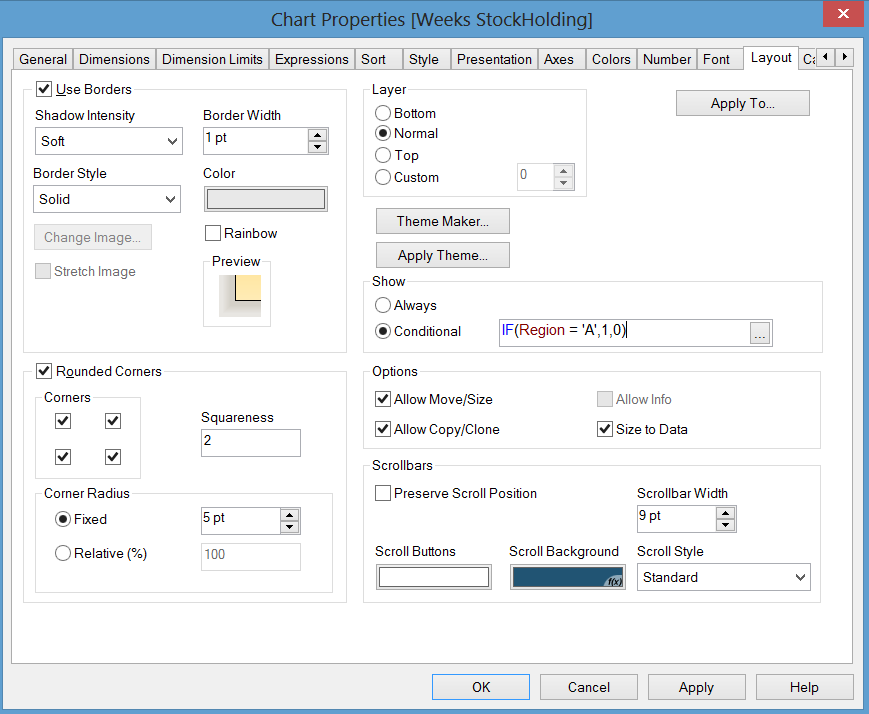
So you can create your charts and then add the following
IF(Region = 'A',1,0) or IF(Region = 'B',1,0) and so on for each region
Add the above IF statement to the Show Conditional in the layout tab for each chart.
Here is an attached image of where to change this

- Mark as New
- Bookmark
- Subscribe
- Mute
- Subscribe to RSS Feed
- Permalink
- Report Inappropriate Content
It sounds like you want to look into Alternate States.
(The Product Grouping tab on the "What's New in QlikView11.qvw" that comes with the QV11 install should give you an example of this.)
- Mark as New
- Bookmark
- Subscribe
- Mute
- Subscribe to RSS Feed
- Permalink
- Report Inappropriate Content
You can do it using conditional show of the charts. One condition for one chart, another condition for another chart.
- Mark as New
- Bookmark
- Subscribe
- Mute
- Subscribe to RSS Feed
- Permalink
- Report Inappropriate Content
If you are using Qlikview 11, you want to use alternate states. You can turn on alternate states in the document properties on the general tab. Once enabled you can assign objects to different states on their individual general tabs in the object properties.
- Mark as New
- Bookmark
- Subscribe
- Mute
- Subscribe to RSS Feed
- Permalink
- Report Inappropriate Content
Hi,
These videos shows how to conditionally display charts
Qlikview Design Variable by RFB 86 - YouTube
Qlikview Design Tip by RFB 92 - YouTube
I hope they help
Regards
Al
- Mark as New
- Bookmark
- Subscribe
- Mute
- Subscribe to RSS Feed
- Permalink
- Report Inappropriate Content
Not Exactly. My requirement is as below:
Suppose i have sales data with respect to regions (A,B,C,D....) now if i choose region A my graph should be a Bar chart,if i choose region B my graph should be a Line graph etc. means for every selection there has to be a different representation of data.
Thanks for the help.
- Mark as New
- Bookmark
- Subscribe
- Mute
- Subscribe to RSS Feed
- Permalink
- Report Inappropriate Content
Ah you could make a graph with 4 separate expressions. Then in the conditional bar for the expression do:
GetFieldSelections(region) ='A' For the first one
GetFieldSelections(region) ='B' for the second.... Etc. Make sure you make it a combo chart then you can select the different representations for each expression.
That way the expression will only show when its specific region is selected
- Mark as New
- Bookmark
- Subscribe
- Mute
- Subscribe to RSS Feed
- Permalink
- Report Inappropriate Content
So you can create your charts and then add the following
IF(Region = 'A',1,0) or IF(Region = 'B',1,0) and so on for each region
Add the above IF statement to the Show Conditional in the layout tab for each chart.
Here is an attached image of where to change this
- Mark as New
- Bookmark
- Subscribe
- Mute
- Subscribe to RSS Feed
- Permalink
- Report Inappropriate Content
Ok Thanks but what if i do not want to create combo charts and want to display completely new charts as per the regions.
- Mark as New
- Bookmark
- Subscribe
- Mute
- Subscribe to RSS Feed
- Permalink
- Report Inappropriate Content
That where you would use my approach above
- « Previous Replies
-
- 1
- 2
- Next Replies »