Unlock a world of possibilities! Login now and discover the exclusive benefits awaiting you.
- Qlik Community
- :
- All Forums
- :
- QlikView App Dev
- :
- How to Get Total TRX per Group per Month
- Subscribe to RSS Feed
- Mark Topic as New
- Mark Topic as Read
- Float this Topic for Current User
- Bookmark
- Subscribe
- Mute
- Printer Friendly Page
- Mark as New
- Bookmark
- Subscribe
- Mute
- Subscribe to RSS Feed
- Permalink
- Report Inappropriate Content
How to Get Total TRX per Group per Month
Hi,
Anyone can help me how to get the Percentage of Trx per Group per Month.
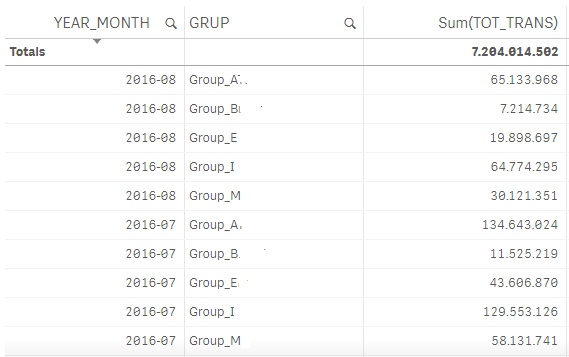
I have the data like this :

Sample : on 2016-07, I want to get the percentage of transaction of Group A, which is :
134.643.024 / (134.643.024 + 11.525.219 + 43.606.870 + 129.553.126 + 58.131.741)
Thanks
- Tags:
- qlikview_scripting
- « Previous Replies
-
- 1
- 2
- Next Replies »
- Mark as New
- Bookmark
- Subscribe
- Mute
- Subscribe to RSS Feed
- Permalink
- Report Inappropriate Content
Hi Sunny,
With This Set Analysis, it Freeze everything.
I need to be able to select Group and still have trend of 12 Months.
For Example : if I select Year_month 2016-03, it will show trend from 2015-05 to 2016-03.
I attach the Qvf file.
Thanks A lot for your help. !
- Mark as New
- Bookmark
- Subscribe
- Mute
- Subscribe to RSS Feed
- Permalink
- Report Inappropriate Content
This seems to be working, isn't it?
Sum({<YEAR_MONTH = {">=$(=Date(AddMonths(Max({1}YEAR_MONTH), -12), 'YYYY-MM'))<=$(=Max({1}YEAR_MONTH))"}>} TOT_TRANS)
/
Sum(TOTAL <YEAR_MONTH> {<YEAR_MONTH>} TOT_TRANS)
- Mark as New
- Bookmark
- Subscribe
- Mute
- Subscribe to RSS Feed
- Permalink
- Report Inappropriate Content
Hi Sunny,
That Set Analysis is almost perfect.
But This Line Chart is keep showing the Data from 2015-08 to 2016-08.
What I need is, if I select Year_month 2016-06, this Line Chart will show the Data from 2015-06 to 2016-06.
Thanks For Your Help
- Mark as New
- Bookmark
- Subscribe
- Mute
- Subscribe to RSS Feed
- Permalink
- Report Inappropriate Content
Then you need to remove the {1} here:
Sum({<YEAR_MONTH = {">=$(=Date(AddMonths(Max({1}YEAR_MONTH), -12), 'YYYY-MM'))<=$(=Max({1}YEAR_MONTH))"}>} TOT_TRANS)
/
Sum(TOTAL <YEAR_MONTH> {<YEAR_MONTH>} TOT_TRANS)
and use this:
Sum({<YEAR_MONTH = {">=$(=Date(AddMonths(Max(YEAR_MONTH), -12), 'YYYY-MM'))<=$(=Max(YEAR_MONTH))"}>} TOT_TRANS)
/
Sum(TOTAL <YEAR_MONTH> {<YEAR_MONTH>} TOT_TRANS)
- Mark as New
- Bookmark
- Subscribe
- Mute
- Subscribe to RSS Feed
- Permalink
- Report Inappropriate Content
Yes, Thanks So Much, I really need to learn More.
- Mark as New
- Bookmark
- Subscribe
- Mute
- Subscribe to RSS Feed
- Permalink
- Report Inappropriate Content
Hahahaha how can you Thanks So Much be a helpful response bro? ![]() Please mark those responses as helpful which helped you and which have a potential of helping others in the future.
Please mark those responses as helpful which helped you and which have a potential of helping others in the future.
Best,
Sunny
- Mark as New
- Bookmark
- Subscribe
- Mute
- Subscribe to RSS Feed
- Permalink
- Report Inappropriate Content
Ooops, sorry, How can I change that ?
Regards
- Mark as New
- Bookmark
- Subscribe
- Mute
- Subscribe to RSS Feed
- Permalink
- Report Inappropriate Content
Check this link:
- « Previous Replies
-
- 1
- 2
- Next Replies »