Unlock a world of possibilities! Login now and discover the exclusive benefits awaiting you.
- Qlik Community
- :
- All Forums
- :
- QlikView App Dev
- :
- How to Refer Value from a field without selecting ...
- Subscribe to RSS Feed
- Mark Topic as New
- Mark Topic as Read
- Float this Topic for Current User
- Bookmark
- Subscribe
- Mute
- Printer Friendly Page
- Mark as New
- Bookmark
- Subscribe
- Mute
- Subscribe to RSS Feed
- Permalink
- Report Inappropriate Content
How to Refer Value from a field without selecting it?
Hi Gurus,
I have a scenario in Pivot. Company Field has 2 values (a,b). we have 2 metrics (Sales/Expenses, Expenses/Sales)
Now I want to show 2 metrics only for company a. For company b want to show only one metric (Sales/Expenses)
If I enable conditional box in the expressions tab, it will work only when I select company a.
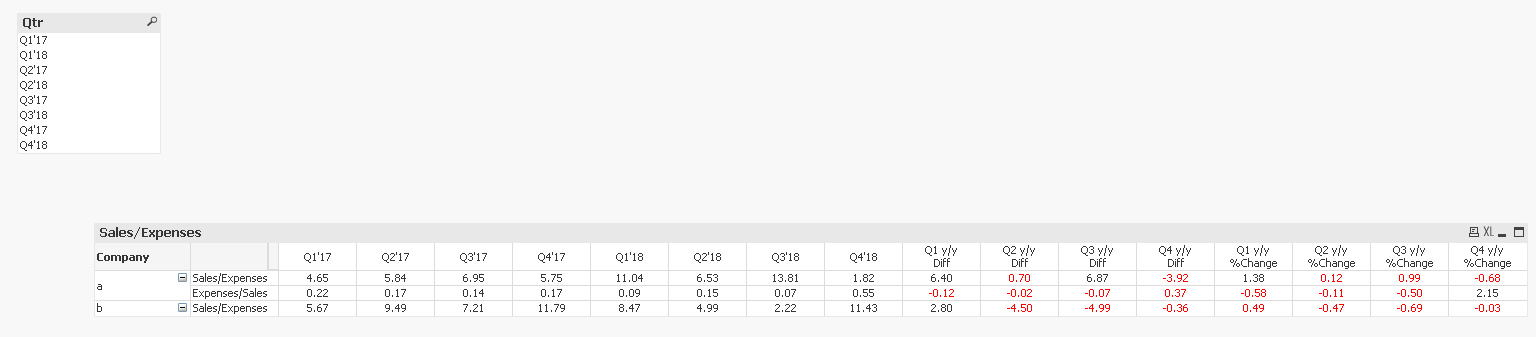
But I want to get the complete view without selecting any company like below snapshot..
| Company | Q1'17 | Q2'17 | Q3'17 | Q4'17 | Q1'18 | Q2'18 | Q3'18 | Q4'18 | Q1 y/y Diff | Q2 y/y Diff | Q3 y/y Diff | Q4 y/y Diff | Q1 y/y %Change | Q2 y/y %Change | Q3 y/y %Change | Q4 y/y %Change | |
| a | Sales/Expenses | 4.65 | 5.84 | 6.95 | 5.75 | 11.04 | 6.53 | 13.81 | 1.82 | 6.40 | 0.70 | 6.87 | -3.92 | 1.38 | 0.12 | 0.99 | -0.68 |
| a | Expenses/Sales | 0.22 | 0.17 | 0.14 | 0.17 | 0.09 | 0.15 | 0.07 | 0.55 | -0.12 | -0.02 | -0.07 | 0.37 | -0.58 | -0.11 | -0.50 | 2.15 |
| b | Sales/Expenses | 5.67 | 9.49 | 7.21 | 11.79 | 8.47 | 4.99 | 2.22 | 11.43 | 2.80 | -4.50 | -4.99 | -0.36 | 0.49 | -0.47 | -0.69 | -0.03 |
Pls find attached app.
Credits: Sunny had customized the view with all possible functional applications.
Kudos to Sunny
Accepted Solutions
- Mark as New
- Bookmark
- Subscribe
- Mute
- Subscribe to RSS Feed
- Permalink
- Report Inappropriate Content
- Mark as New
- Bookmark
- Subscribe
- Mute
- Subscribe to RSS Feed
- Permalink
- Report Inappropriate Content
Here you go
- Mark as New
- Bookmark
- Subscribe
- Mute
- Subscribe to RSS Feed
- Permalink
- Report Inappropriate Content
Small Tweek,
Have Data for 9 Qtrs (4 qtrs of 2 Yrs and 1 Qtr for 3rd year), In this case, comparison is missing others Qtrs (Q2,Q3,Q4) as the Data for these Qtrs is unavailable for the Max Year. Find below example.
we do have data for all 4 Qtrs of FY17, FY18 and have Q1'19 Data as well. Hence the table is not picking Q2,Q3,Q4 for comparison as the current expression is based on Max Year. How to qualify Max year with Qtr so that the issue can be fixed.
| Q1'17 | Q2'17 | Q3'17 | Q4'17 | Q1'18 | Q2'18 | Q3'18 | Q4'18 | Q1'19 | Q1 y/y Diff | Q2 y/y Diff | Q3 y/y Diff | Q4 y/y Diff | Q1 y/y %Change | |
| Sales/Expenses | 5.67 | 9.49 | 7.21 | 11.79 | 8.47 | 4.99 | 2.22 | 11.43 | 1.31 | -7.15 | -4.99 | -2.22 | -11.43 | -0.84 |
| Expenses/Sales | 0.18 | 0.11 | 0.14 | 0.08 | 0.12 | 0.20 | 0.45 | 0.09 | 0.76 | 0.64 | -0.20 | -0.45 | -0.09 | 5.45 |
- Mark as New
- Bookmark
- Subscribe
- Mute
- Subscribe to RSS Feed
- Permalink
- Report Inappropriate Content
I am not sure I follow?
- Mark as New
- Bookmark
- Subscribe
- Mute
- Subscribe to RSS Feed
- Permalink
- Report Inappropriate Content
in the attachment "% Change" Dimension - the Table doesn't have the metrics updated for Q2,Q3 and Q4 %Change
Is the Reason being data is unavailable for Max Year (2019 for Q2,Q3,Q4)? !
what changes to be done in expression?
- Mark as New
- Bookmark
- Subscribe
- Mute
- Subscribe to RSS Feed
- Permalink
- Report Inappropriate Content
Yes, that appears to be the problem... I think you need to change your set analysis to fix this... your set analysis is only looking at the FYear and not Month or Quarter....
- Mark as New
- Bookmark
- Subscribe
- Mute
- Subscribe to RSS Feed
- Permalink
- Report Inappropriate Content
Guru,
I got your answer, but haven't succeed yet to accommodate Quarter in the set analysis for Max Year condition ( FYear = {$(=Max(****FYear)-1)}>} ) , I am trying to fill **** in the expression with Quarter condition but couldn't succeed.